Session 5: Exercise sheet
Download the PDF · Download the Word file (to fill in) · Back to Session 5
Foundations of Clinical Research · Level 1 · Neudata · #ClearDataClearImpact · Week 5 · Saturday 28 November 2026 · online, 19:30–22:30
Name: ______________________________ Department: ______________________________
This sheet is sent by email before the session, as a Word file and as a PDF. Type your answers into the Word file (or print the PDF). In class we do Exercises 2, 6 and 7 together as a whole class (you answer in the chat or a poll; the instructor types the class answer on the shared screen). The other exercises are homework or self-check. No calculator is needed: every exercise is about choosing and interpreting. Exercises marked [FLUID-ICU] use the course dataset FLUID-ICU (simulated) and the results packs in Course/Data/results_packs/ (Results_Pack_Q1 to Q5, also sent as PDFs). Exercise 8 becomes part of your own proposal (Part 3).
| # | Exercise | When | Time |
|---|---|---|---|
| 1 | Classify the variables | homework / self-check (after the 5.1 quiz) | 5 min |
| 2 | Fix the bad CRF items | 5.1 whole-class task | 7 min |
| 3 | Choose the right summary | 5.3 check / homework | 3 min |
| 4 | Judge a bad figure | homework | 5 min |
| 5 | [FLUID-ICU] Spot the problems in the raw FLUID-ICU data | homework (after the 5.2 demo) | 5 min |
| 6 | [FLUID-ICU] Read the FLUID-ICU Table 1 | 5.4 whole-class task | 10 min |
| 7 | [FLUID-ICU] Your manuscript question as a PECO sentence | 5.2 whole-class task (Q1); later for the question you choose | 4 min |
| 8 | Proposal builder 5 worksheet (your own proposal) | proposal builder: instructor models, you draft; finish as homework | 30 min |
Exercise 1: Classify the variables
For each variable, tick one type.
| # | Variable (ICU study of septic shock) | Continuous | Count | Binary | Nominal | Ordinal | Time-to-event |
|---|---|---|---|---|---|---|---|
| a | Age at ICU admission (years) | ☐ | ☐ | ☐ | ☐ | ☐ | ☐ |
| b | Sex (male / female) | ☐ | ☐ | ☐ | ☐ | ☐ | ☐ |
| c | Glasgow Coma Scale on admission (3–15) | ☐ | ☐ | ☐ | ☐ | ☐ | ☐ |
| d | Main source of sepsis (lung / urine / abdomen / skin / other) | ☐ | ☐ | ☐ | ☐ | ☐ | ☐ |
| e | Number of vasopressors running at 24 h (0, 1, 2, 3) | ☐ | ☐ | ☐ | ☐ | ☐ | ☐ |
| f | Cumulative fluid balance at day 5 (ml/kg) | ☐ | ☐ | ☐ | ☐ | ☐ | ☐ |
| g | Alive at day 28 (yes / no) | ☐ | ☐ | ☐ | ☐ | ☐ | ☐ |
| h | Time from ICU admission to death (patients alive at day 28 are censored) | ☐ | ☐ | ☐ | ☐ | ☐ | ☐ |
| i | Pain: none / mild / moderate / severe | ☐ | ☐ | ☐ | ☐ | ☐ | ☐ |
| j | Blood group (A, B, AB, O) | ☐ | ☐ | ☐ | ☐ | ☐ | ☐ |
Bonus: which ONE of these would you most like to collect as an exact number rather than in groups, and why?
Exercise 2: Fix the bad CRF items
In class the instructor shows one item at a time on the shared screen; type your rewrite in the chat. Each item below can be filled in two different ways by two different nurses. Rewrite it so that it has only one possible reading. Check yourself: unit? time point? one answer only? an “unknown / not done” option?
| # | Bad item | What is wrong? | Your rewritten item |
|---|---|---|---|
| a | Fluid given: ________ | ||
| b | Weight: ______ | ||
| c | Comorbidities: ______________________ | ||
| d | Lactate high? Y / N |
Exercise 3: Choose the right summary
For each variable, choose the summary you would report in Table 1 and the best graph.
| # | Variable (200 ICU patients) | Shape / type | Summary | Graph |
|---|---|---|---|---|
| a | Age (years), bell-shaped | |||
| b | ICU length of stay (days): most 1–5 days, a few > 30 days | |||
| c | Died in hospital (yes / no) | |||
| d | C-reactive protein (mg/L): long right tail | |||
| e | Source of sepsis (5 categories) | |||
| f | Systolic blood pressure, compared between two treatment groups |
Exercise 4: Judge a bad figure
A poster in the hospital corridor shows this figure (fluid balance at day 5, 24 patients per group):
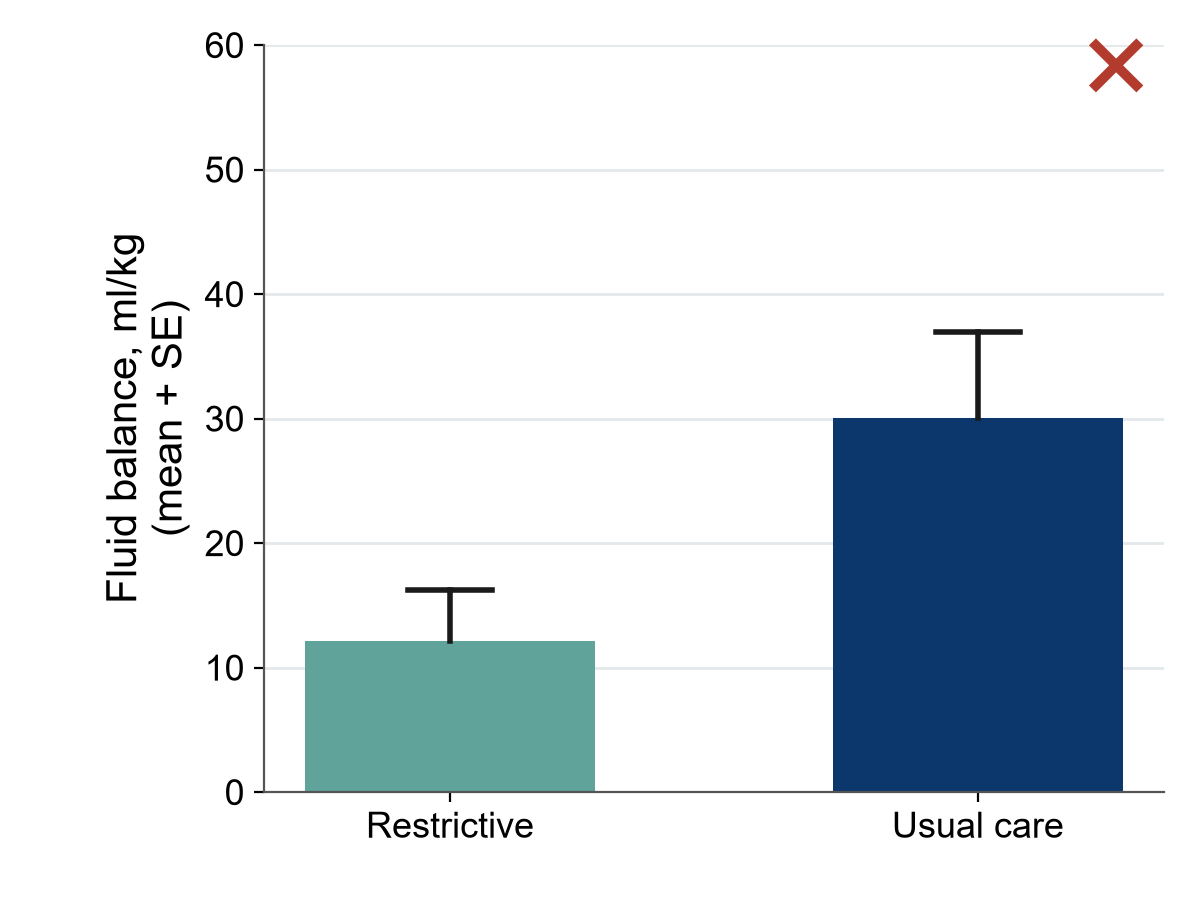
- What does each bar show, and what does the error bar show? What is missing?
- Name two things the reader cannot see in this figure.
- Redraw it (sketch) the way you would show it in a paper. What do you gain?
A second poster shows ward mortality as bars of 31% (Ward A) and 29% (Ward B), with the y-axis running from 28% to 32%.
- What impression does it give, and how would you fix it?
- A third poster puts hand-hygiene compliance (%) and infection rate on one graph with two different y-axes and writes “hygiene works!”. Give two reasons to be careful.
Exercise 5: [FLUID-ICU] Spot the problems in the raw FLUID-ICU data
Below are six cells copied from the raw file Course/Data/fluid_icu_raw.csv (as the four ICUs sent it). For each, say what is wrong and what the cleaning script should do.
| # | Column | Value in the raw file | What is wrong? | What should the script do? |
|---|---|---|---|---|
| a | sex | m, male, Female |
||
| b | admission date | 14/03/2023 in one row, 14-Mar-2023 in another |
||
| c | lactate (ICU C) | 23.4 |
||
| d | lactate | 999 |
||
| e | age | 210 |
||
| f | patient ID | FLU-139 appears in two identical rows |
Bonus: why must the raw file never be edited by hand? Name two things the cleaning log records for every change.
Exercise 6: [FLUID-ICU] Read the FLUID-ICU Table 1 (results pack)
Open Table 1 (baseline characteristics by fluid-balance group) in any results pack: the same table is in all five (Course/Data/results_packs/Results_Pack_Q1 to Q5, PDF). In class we answer questions 1 to 5 together; question 6 is for you.
- How many patients are in each column? Why is the overall number 618 and not 620?
- For three variables, write the summary used (mean (SD), median (IQR) or n (%)) and why.
| Variable | Summary used | Why this summary? |
|---|---|---|
- Were the two groups alike at the start? Name the biggest difference between the negative- and positive-balance groups.
- Which variable has the most missing values, and how many?
- Write two sentences describing the patients, as they would appear at the start of the Results section of your manuscript (numbers in brackets, no p-values).
- Looking at this table, would you expect the crude association between positive fluid balance and death to be larger or smaller than the adjusted one? Why?
Exercise 7: [FLUID-ICU] Your manuscript question as a PECO sentence (5.2)
In class we fill this in together for Question 1 (Q1). Afterwards, fill it in for the ONE question (Q1 to Q5) you choose for your manuscript. PECO: P = population, E = exposure, C = comparison, O = outcome.
| Your answer | |
|---|---|
| Your chosen question (Q1 to Q5), copied from page 1 of its results pack | |
| P: population | |
| E: exposure (variable name in the data dictionary) and its type | |
| C: comparator | |
| O: outcome (variable name) and its type | |
| One-sentence research question | |
| Which test will compare the groups? Which model will adjust? (guess now, check in Session 6) |
Exercise 8: Proposal builder 5 worksheet (individual)
The instructor models each part on the running example; then you draft the variables table in class (8 minutes) and finish the rest as homework. Write your answers here first, then copy them into Part 3 of your own proposal template (Course/Templates/Research_Proposal_Template.docx). (Your own question, not the course dataset.)
8.1 Variables table (8 min)
| Role | Variable | How measured (unit, time point) | Type |
|---|---|---|---|
| Primary outcome | |||
| Secondary outcome (optional) | |||
| Exposure / intervention | |||
| Confounder 1 | |||
| Confounder 2 | |||
| Confounder 3 | |||
| Descriptive (e.g. age, sex) |
Tip: if your design is an RCT, confounders are less of a problem (randomisation), but list the key baseline variables you will show in Table 1.
8.2 Mini-CRF: 6–10 items (10 min)
| # | Question exactly as the data collector will read it | Answer format (boxes / ticks / unit) | “Unknown / not done” option? |
|---|---|---|---|
| 1 | ☐ | ||
| 2 | ☐ | ||
| 3 | ☐ | ||
| 4 | ☐ | ||
| 5 | ☐ | ||
| 6 | ☐ | ||
| 7 | ☐ | ||
| 8 | ☐ |
8.3 Data dictionary: 3–5 rows + one data-quality rule (6 min)
| Variable name | Label (meaning) | Type | Unit / codes | Allowed values |
|---|---|---|---|---|
Data-quality plan (one or two sentences): who checks the forms, how often, and what range/consistency check you will run.
8.4 Data-management plan (6 min)
| Question | Our answer |
|---|---|
| Paper CRF with double data entry, or electronic data capture (e.g. REDCap / KoBoToolbox)? | |
| Coded study IDs? Where is the linking log kept, and who can open it? | |
| Validation rules at entry (two examples from your data dictionary) | |
| Audit trail / cleaning log: who records changes? | |
| Backups (3-2-1) and data-sharing statement in the consent form |