Course levels
TipWhere you are: Level 1
This website is Level 1: Foundations, the whole 8-session course, from a clinical question to a draft manuscript. Level 2 and Level 3 are separate courses that build on it.
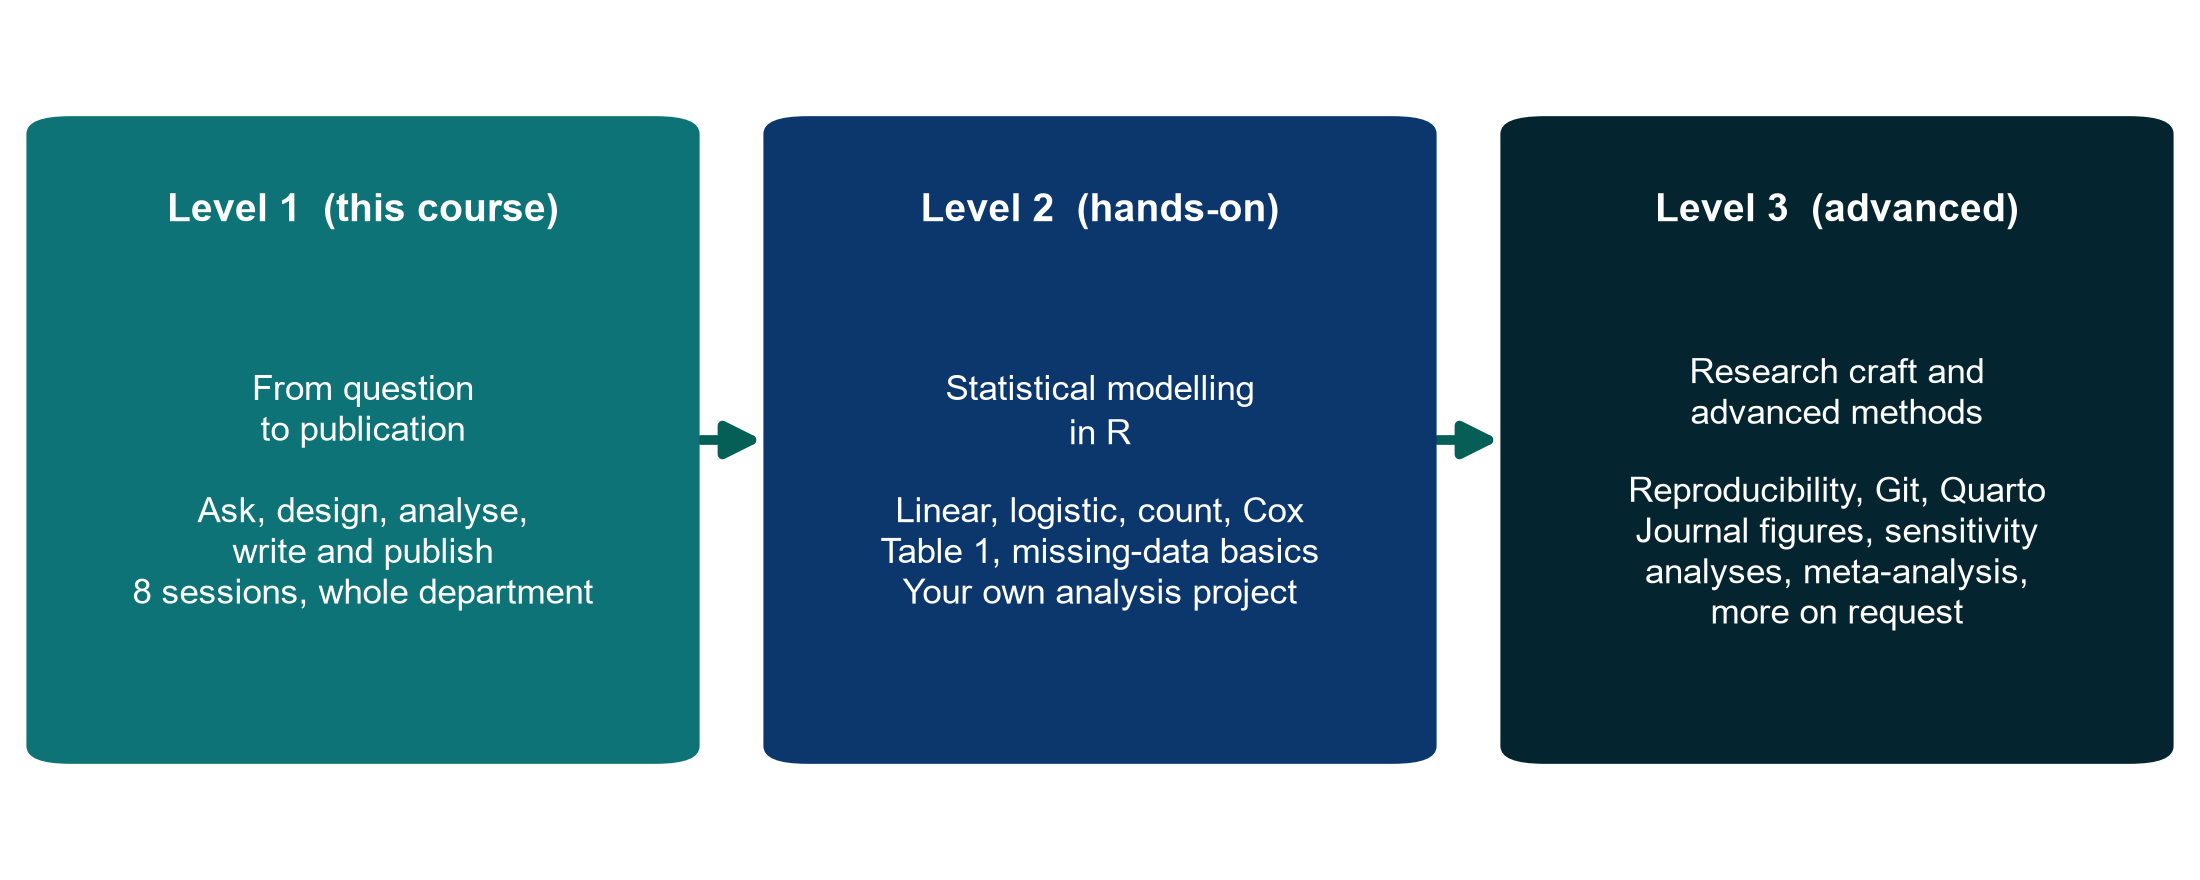
- Level 1: Foundations (this course). Understand research from question to publication. Online, for health professionals (doctors, nurses, etc.), no software needed; the analyses are demonstrated live on FLUID-ICU.
- Level 2: Doing the analysis (in preparation). A separate course in R on statistical modelling, for those who want to run, check and report the analyses themselves.
- Level 3: Advanced topics (on request). Reproducible research, journal-quality figures and specialised methods for complex designs and data, as workshops or consultancy on the participant’s own project.
Download the course levels overview (PDF)
Organisation: Neudata · #ClearDataClearImpact
Neudata’s clinical-research training runs in three levels. Each level builds on the one before, and each department can stop at the level that fits its needs.
| Level 1: Foundations | Level 2: Doing the analysis | Level 3: Advanced topics | |
|---|---|---|---|
| In one line | Understand research from question to publication | Fit, check and interpret the common statistical models yourself, in R | Reproducible research, journal-quality output and specialised methods for complex data |
| Who | A whole department (about 30 health professionals: doctors, nurses, etc.) | An interested subgroup (8 to 12) who want to run their own analyses | Researchers with a specific project or dataset |
| Prerequisites | None | Level 1 and the free Neudata course Clinical Data Analysis in R (or equivalent basics) | Level 2 (or equivalent experience), plus a real question or dataset |
| Format | 8 online sessions of 3 hours, every Saturday for 8 weeks | 8 online sessions of 3 hours over about 4 to 6 weeks, with homework | Online workshops of 1 or 2 sessions, or consultancy, on request |
| Software | None for participants (instructor demos) | R and RStudio on own laptops | R (and specialised packages) |
| Hands-on? | Concepts, reading and interpreting; analyses demonstrated live on FLUID-ICU | Every session is hands-on coding; the class works together, exercises are individual | Hands-on on the participant’s own data |
| Outcome | An individual research proposal and an individual draft manuscript | R scripts for an analysis question and a draft Results section | A reproducible analysis, or an analysis plan, for a real project, with Neudata support |
| Documents | This website (the full Level 1 course) | Level 2 | Level 3 |
How the levels connect
- From Level 1 to Level 2. In Level 1, participants read the FLUID-ICU analyses (Table 1, crude vs adjusted ORs, Kaplan-Meier, multiple imputation) that the instructor runs. Level 2 is a statistical-modelling course: participants clean and describe the data, then fit, check and interpret the models that clinical papers use most (linear, logistic, Poisson, negative binomial, zero-inflated and Cox), each session starting with the exploratory data analysis (EDA) suited to that model. It ends with an individual analysis question and a written Results section. The FLUID-ICU dataset and R scripts in
Course/Data/are shared by both levels. - From Level 2 to Level 3. Level 3 adds the research-craft topics moved out of Level 2 (reproducible projects, version control, Quarto reports, figures that meet journal requirements, and missing-data and sensitivity analyses in depth) and the methods that complex data demand (meta-analysis, prediction models, diagnostic accuracy, advanced survival analysis, longitudinal and multilevel models, large or clustered datasets). Every Level 3 lecture includes an EDA section and journal-ready figure code for its analysis problem.
Progression at a glance
| Skill | Level 1 | Level 2 | Level 3 |
|---|---|---|---|
| Research question, design, ethics | Taught in depth | Assumed | Assumed |
| Data management and cleaning | Concepts; live demo | Hands-on in R scripts: import, clean, validate, cleaning log | Reproducible projects and version control (Module G); large, linked or clustered data (Module F) |
| Describing data, Table 1, figures | Read and judge | Table 1; EDA plots suited to each model, from course code | Figures that meet journal requirements (vector vs raster, dimensions, resolution, fonts) and figure code in every module |
| Regression | Read and interpret outputs | Fit, check, interpret and report linear, logistic, count (Poisson, negative binomial, zero-inflated) and Cox models | Mixed models, competing risks, time-varying covariates, prediction models |
| Missing data | Mechanisms and ideas | Describe missingness; complete-case vs multiple imputation, touched on | Multiple imputation in practice and sensitivity analyses in depth (Module H) |
| Survival analysis | Read Kaplan-Meier and HRs | Kaplan-Meier and Cox, including the proportional-hazards check | Advanced: time-varying covariates, competing risks, restricted mean survival time (Module D) |
| Writing and publishing | Full manuscript workflow (individual draft) | Results section written from own R output | Quarto reports in which every number comes from code; Methods and Results for complex analyses |
Status: Level 1 materials are in Course/. Level 2 and Level 3 are outlines. Their materials will be developed after Level 1 has run.