Session 4: Exercise sheet
Download the PDF · Download the Word file (to fill in) · Back to Session 4
Foundations of Clinical Research · Level 1 · Neudata · #ClearDataClearImpact · Week 4 · Saturday 21 November 2026 · online, 19:30–22:30
Name: ______________________________ Department: ______________________________
This sheet is sent by email before the session, as a Word file and as a PDF. Keep it open on your screen and type your answers into the Word file (or print the PDF). Have a pen, paper and a calculator (or your phone) ready. For the calculations, simple division is enough. The instructor checks every answer live with the 2x2 calculator (Course/Resources/tools/2x2_calculator.xlsx).
All in-session exercises are done by the whole class together: the instructor shows each item on the shared screen, you answer in the poll or the chat, and the instructor types the class answer on the shared screen. There are no groups. The proposal builder (Part F) is your own individual work.
| Part | Activity | When | How |
|---|---|---|---|
| A | Spot the bias (4 scenarios) | End of section 4.1 (5 min) | Whole class: poll for each scenario, one fix in the chat |
| B | Confounding or effect modification? (3 scenarios) | Homework (optional) | On your own |
| C | Two 2x2 calculations | After the break (15 min) | Whole class: poll for each answer |
| D | PPV in two settings | Homework (optional) | On your own |
| E | Read a forest plot and choose the risk-of-bias tool | End of section 4.3 (8 min) | Whole class: polls and chat |
| F | Proposal builder 4: exposure, outcomes and biases | End of the session (38 min) and homework | Instructor models it live; then you draft your own |
Our running question: in adults with septic shock, does a restrictive fluid strategy, compared with usual care, reduce 28-day mortality? The two papers (course folder, Course/Papers): Paper 1, Boulet 2024 (a pilot randomised trial of restrictive fluids); Paper 2, Hyun 2023 (a registry cohort of fluid balance and death).
Key words of the day: bias · confounding · effect modification (interaction) · reverse causation · risk · risk ratio (RR) · risk difference (RD) · number needed to treat (NNT) · odds ratio (OR) · sensitivity · specificity · positive and negative predictive value (PPV, NPV) · ROC (receiver operating characteristic) curve · forest plot · I-squared (I², heterogeneity) · risk-of-bias tool.
Other abbreviations on this sheet: ICU = intensive care unit; CI = confidence interval; RCT = randomised controlled trial.
Part A: Spot the bias
How it runs. The instructor shows each scenario and opens a poll: selection bias, recall bias, observer bias or confounding. After the result, type one practical way to reduce it in the chat.
| # | Scenario | Main bias | One way to reduce it |
|---|---|---|---|
| 1 | In a case-control study, families of patients who died of sepsis remember the days before ICU admission in more detail than families of survivors. | ||
| 2 | In an unblinded trial of restrictive fluids, the doctor who knows each patient’s group decides when the patient is “ready for ICU discharge”. | ||
| 3 | A study of fluid balance and death includes only patients who stayed in the ICU for 3 days or more. | ||
| 4 | In a registry, patients with a higher lactate received more fluid and also died more often. The authors conclude that fluid increases mortality. |
Part B: Confounding or effect modification? (homework, optional)
Instructions. Each study splits its result by a third factor. Compare the strata with each other and with the overall (crude) result. Decide: confounding, effect modification (interaction) or neither. Then say what the authors should report.
Rule of thumb: strata similar to each other but different from the crude result mean confounding. Strata different from each other mean effect modification.
| # | Study (hypothetical) | Overall RR | Stratum 1 | Stratum 2 | Your answer | What to report |
|---|---|---|---|---|---|---|
| 1 | Vasopressor X vs Y in septic shock and death by day 28. Clinicians chose X mainly for patients with a high lactate. | 1.80 | lactate below 4: RR 1.00 | lactate 4 or more: RR 1.00 | ||
| 2 | Restrictive vs usual fluids and death by day 28 | 0.70 | age below 65: RR 0.50 | age 65 or over: RR 0.95 | ||
| 3 | A nurse-led charting protocol and incomplete fluid charts | 0.80 | day shift: RR 0.80 | night shift: RR 0.79 |
Part C: Two 2x2 calculations
How it runs. Draw each table on your paper first. The instructor then asks each answer as a poll, checks it live with the 2x2 calculator on the shared screen, and a volunteer says the result in one plain sentence.
- Draw the 2x2 table first. Exposure (or treatment) in rows, with the exposed or treated group on top. Outcome in columns, with “outcome yes” on the left.
- Round to two decimals.
- Say the result in one sentence a colleague without research training would understand.
Reminder
| Measure | Formula (from the table a, b, c, d) |
|---|---|
| Risk in exposed or treated | a / (a + b) |
| Risk in unexposed or control | c / (c + d) |
| Risk ratio (RR) | risk exposed ÷ risk control |
| Risk difference (RD) | risk exposed minus risk control |
| Number needed to treat (NNT) | 1 ÷ |RD| (RD written as a proportion, e.g. 0.05) |
| Odds ratio (OR) | (a × d) ÷ (b × c) |
Calculation 1: a fluid trial
A hypothetical trial randomised 400 adults with septic shock to a restrictive fluid strategy (200 patients) or usual care (200 patients). By day 28, 20 patients had died in the restrictive group and 30 in the usual-care group.
| Died by day 28: YES | Died by day 28: NO | Total | |
|---|---|---|---|
| Restrictive | a = | b = | |
| Usual care | c = | d = |
- Risk with restrictive fluids = ______ Risk with usual care = ______
- RR = ______ 3. RD = ______ 4. NNT = ______ 5. OR = ______
- The worked example in the slides had the same RR (20/100 vs 30/100). Why is the NNT different here? ______________________
- One sentence for a colleague: ____________________________________________
Calculation 2: a fluid case-control study
Investigators selected 40 ICU patients with sepsis who needed new dialysis (cases) and 80 ICU patients with sepsis from the same units who did not (controls). They looked back at each patient’s fluid balance on day 3. Among the cases, 24 had a positive balance and 16 had not. Among the controls, 16 had a positive balance and 64 had not.
| Cases (new dialysis) | Controls (no dialysis) | |
|---|---|---|
| Positive fluid balance on day 3 | a = | b = |
| Zero or negative balance | c = | d = |
- OR = ______
- Why can you not calculate the risk of dialysis, the RR or the NNT from this study? ______________________________
- Could the arrow run the other way here (reverse causation)? Why? ______________________________
- One sentence for a colleague: ____________________________________________
Note: in a case-control study the columns are the case and control groups. The OR formula (a × d) ÷ (b × c) stays the same.
Extra practice (self-study): another topic
A trial randomised 400 adults on a medical ward to a new pressure-relieving mattress (200 patients) or a standard mattress (200 patients). A new pressure injury developed in 10 patients on the new mattress and in 20 on the standard mattress. Draw the table and calculate the two risks, RR, RD, NNT and OR. Is the OR close to the RR here? Why?
Part D: PPV in two settings (homework, optional)
Instructions. The same test has sensitivity 90% and specificity 80%. Complete each table for 500 people, then calculate PPV and NPV.
Disease present = prevalence × 500. True positives (TP) = sensitivity × disease present. True negatives (TN) = specificity × disease absent. FP = false positives; FN = false negatives.
Setting 1: ICU, prevalence 20%
| Disease present | Disease absent | Total | |
|---|---|---|---|
| Test positive | TP = | FP = | |
| Test negative | FN = | TN = | |
| Total | 500 |
PPV = TP / (TP + FP) = ______ NPV = TN / (TN + FN) = ______
Setting 2: screening, prevalence 2%
| Disease present | Disease absent | Total | |
|---|---|---|---|
| Test positive | TP = | FP = | |
| Test negative | FN = | TN = | |
| Total | 500 |
PPV = ______ NPV = ______
- Why is the PPV so different when the test is the same? ________________________________
- Calculate the positive likelihood ratio, LR+ = sensitivity / (1 − specificity) = ______. Does it change between the settings? ______
- Optional: repeat for a prevalence of 50%.
Part E: Read a forest plot and choose the risk-of-bias tool
How it runs. The instructor shows the plot on the shared screen and asks each question as a poll or in the chat. The plot is the one shown in section 4.3 (six hypothetical trials of restrictive vs usual fluids; outcome death; fixed-effect pooling).
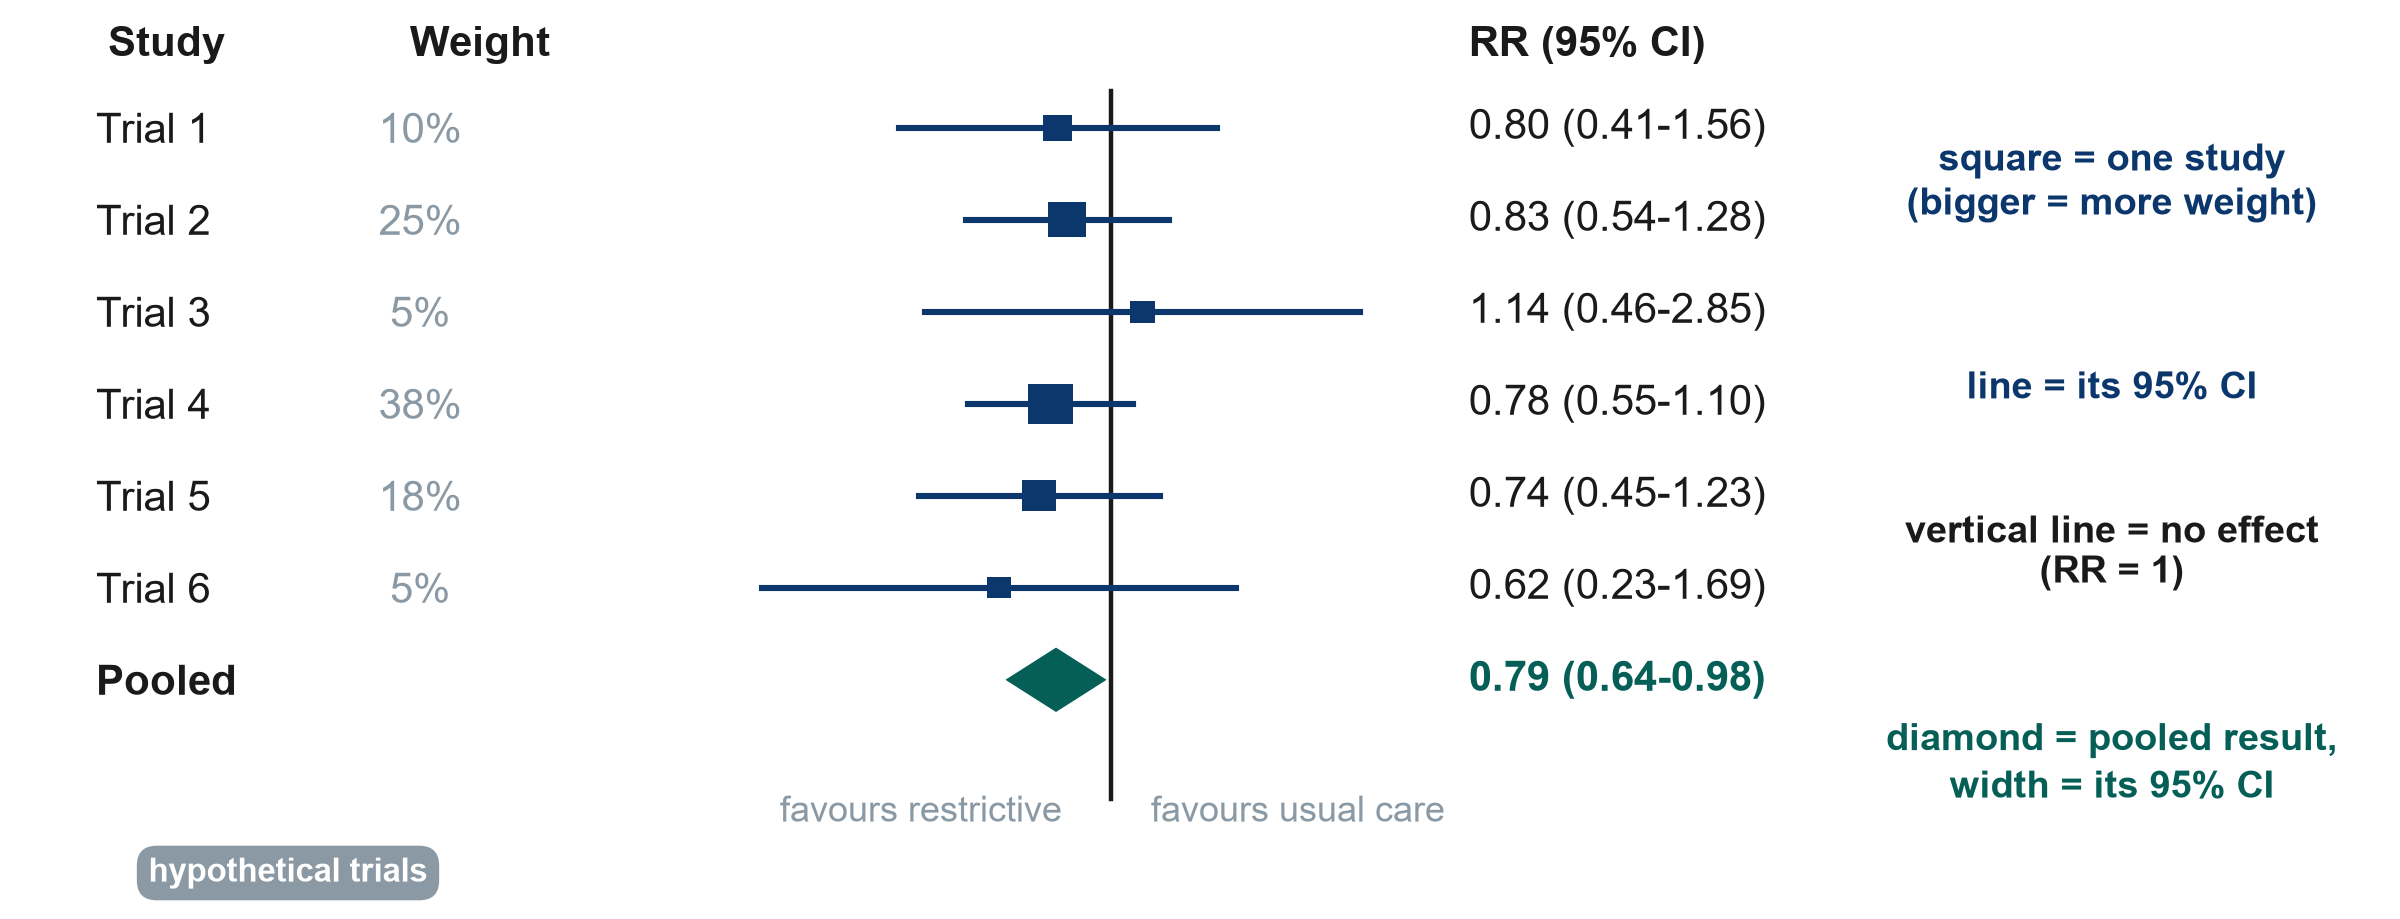
| Trial | Restrictive: died / total | Usual care: died / total |
|---|---|---|
| Trial 1 | 12 / 60 | 15 / 60 |
| Trial 2 | 30 / 150 | 36 / 150 |
| Trial 3 | 8 / 40 | 7 / 40 |
| Trial 4 | 45 / 250 | 58 / 250 |
| Trial 5 | 20 / 100 | 27 / 100 |
| Trial 6 | 5 / 30 | 8 / 30 |
Reading the plot
- (Poll) Which trial carries the most weight? Why? ______________________
- (Poll) Does any single trial show a clear effect (a 95% CI that does not cross 1)? ______________________
- (Chat) Does the pooled diamond cross RR = 1? Write the pooled result in one plain sentence. ______________________
- (Self-study) Trial 3 points the other way (RR 1.14). Should it worry you? Why or why not? ______________________
Choosing the tool (poll). For each study, choose: RoB 2 (Cochrane risk-of-bias tool for randomised trials), ROBINS-I (non-randomised studies of interventions), Newcastle-Ottawa Scale (or ROBINS-E) (cohort or case-control studies of exposures), QUADAS-2 (diagnostic accuracy studies) or AMSTAR 2 (systematic reviews). A one-page chooser is in Course/Resources/Risk_of_Bias_Tool_Chooser.pdf.
| # | Study | Tool |
|---|---|---|
| a | Paper 1, Boulet 2024: randomised trial of restrictive vs usual fluids | |
| b | Paper 2, Hyun 2023: registry cohort, positive vs negative fluid balance | |
| c | Systematic review and meta-analysis of fluid-restriction trials | |
| d | (Self-study) Before-after study of a fluid protocol on one unit | |
| e | (Self-study) Point-of-care lactate compared with the laboratory reference test | |
| f | (Self-study) Cluster-randomised trial of a fluid-charting protocol (12 ICUs) |
Part F: Proposal builder 4 (exposure, outcomes and biases)
This is your own work. Every participant writes their own research proposal on a question from their own department (see Course/Assignment/proposal_brief.md).
How it runs (38 minutes).
- Watch (15 min). The instructor fills in rows 4-6 below for the running example on the shared screen, thinking aloud.
- Draft (16 min). You fill in the same rows for your own question, quietly (cameras optional). Ask questions in the chat.
- Feedback (7 min). Three volunteers paste one bias and its fix in the chat; the instructor comments.
Then finish as homework and copy your answers into the proposal template (Course/Templates/Research_Proposal_Template.docx, Part 2). Rows 1-3 (design, setting, population) were drafted after Session 3. For every outcome write what, how and when.
My research question: _______________________________________________
| # | Section | What to write | My answer |
|---|---|---|---|
| 4 | Exposure or intervention and comparator | What exactly is the exposure or intervention, and how is it defined or measured? Who is the comparison group? | |
| 5 | Outcomes | ONE primary outcome: what it is, how and when it is measured. 2-3 secondary outcomes. | |
| 6 | Main biases and how I reduce them | Name at least two threats (selection, information, confounding) and the step in your design that reduces each. |
My claim at the end will be: ☐ “caused” (randomised design) ☐ “associated with” (observational design), because ____________________
Self-check before you finish