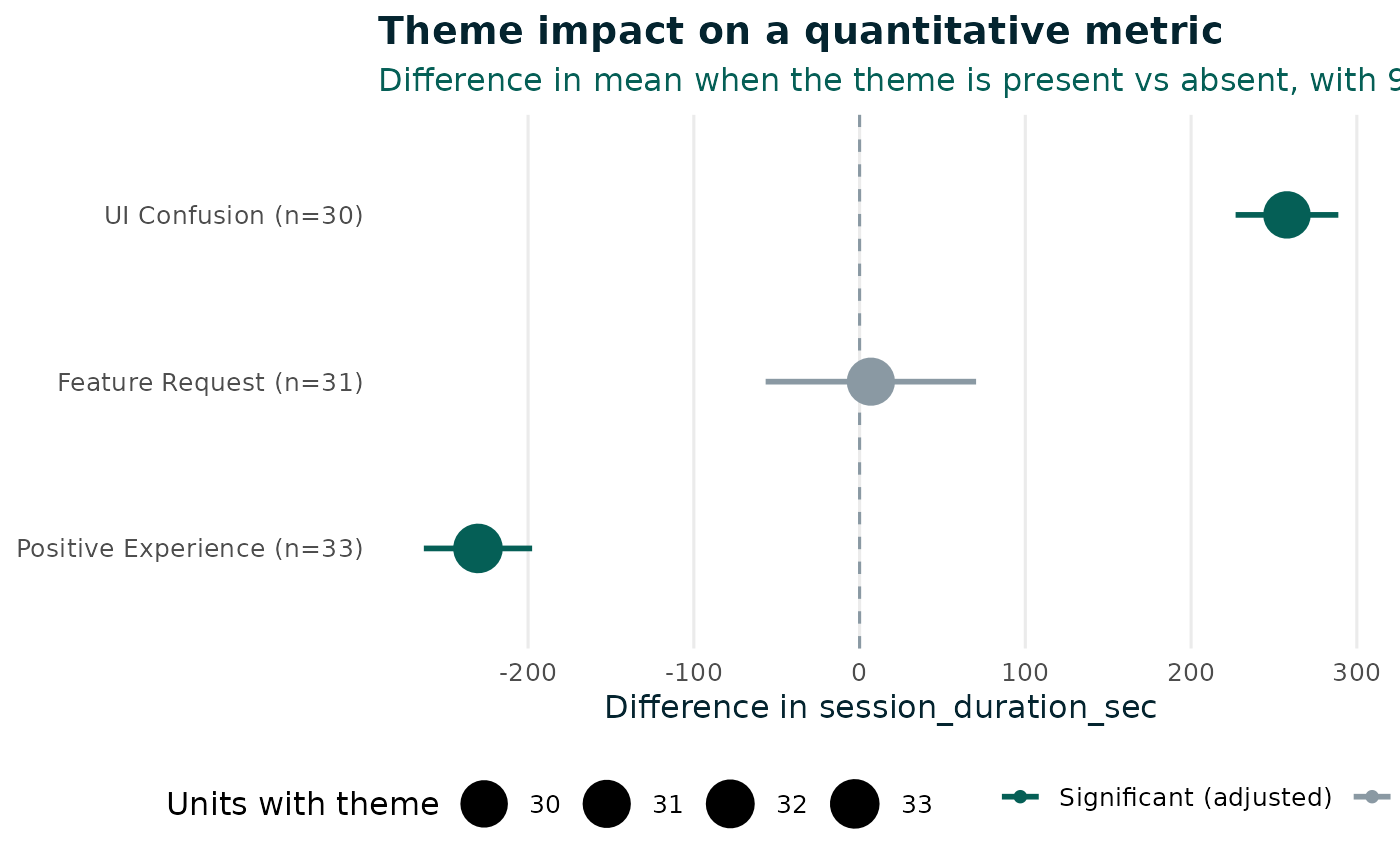
Plot how a metric shifts when each qualitative theme is present
Source:R/plot_theme_impact.R
plot_theme_impact.RdDraws one row per theme showing the difference in the metric mean (theme present minus absent) with its confidence interval. Point size shows how many units carry the theme; colour marks themes that remain significant after multiple-comparison adjustment.
Arguments
- cross_tab_data
A tibble returned by
cross_tab_themes().- metric_label
Axis label for the metric. Defaults to the metric name recorded by
cross_tab_themes().
Examples
df <- mock_mixed_data(80, seed = 42)
coded <- llm_auto_code(df, user_id, transcript_feedback,
                       codebook = c("UI_Confusion", "Positive_Experience",
                                    "Feature_Request"),
                       coder = mock_coder())
plot_theme_impact(cross_tab_themes(coded, session_duration_sec))