Session 6 · Analyse: from sample to answer

Foundations of Clinical Research: From Clinical Question to Publication

Vương Mỹ Lượng & Bernard Osang’ir

Neudata Consulting Ltd

Session 6 · Analyse: from sample to answer

Part 1

Week 6 · Saturday

  • Recap quiz on Session 5 (10 min)
  • 6.1 From sample to population: CI, p-value, one- or two-sided, power, sample size, choosing a test
  • 6.2 Compare groups in the course dataset (live R demo)
  • 6.3 Relationships and models: regression, Kaplan-Meier and Cox
  • 6.4 Model the course dataset: adjusted OR, Cox HR, missing data, the SAP
  • Proposal builder 6: sample size, analysis plan, missing-data plan

Recap quiz: Session 5 in three questions

QUICK QUIZ · 10 min

  • Q1. ICU length of stay in 300 patients is right-skewed. Which summary goes in Table 1?
  • Q2. A CRF item reads ‘Lactate: ____’. Name two things missing.
  • Q3. In the raw FLUID-ICU data, one age was 210. Which check catches it, and what goes in the cleaning log?
  • Q1 in a poll. Q2 and Q3: two or three people answer with the microphone on (1 to 2 minutes each)

Answers (reveal after)

  • Q1: median (IQR)
  • Q2: unit (mmol/L), time point, ‘not done’ option
  • Q3: range check. The value, the correction, the reason, who and when

OUTPUT Everyone back on track with data types, CRF items and cleaning

6.1 From sample to population, without fear

We study a few patients to learn about many.

6.1 From sample to population | 40 minutes

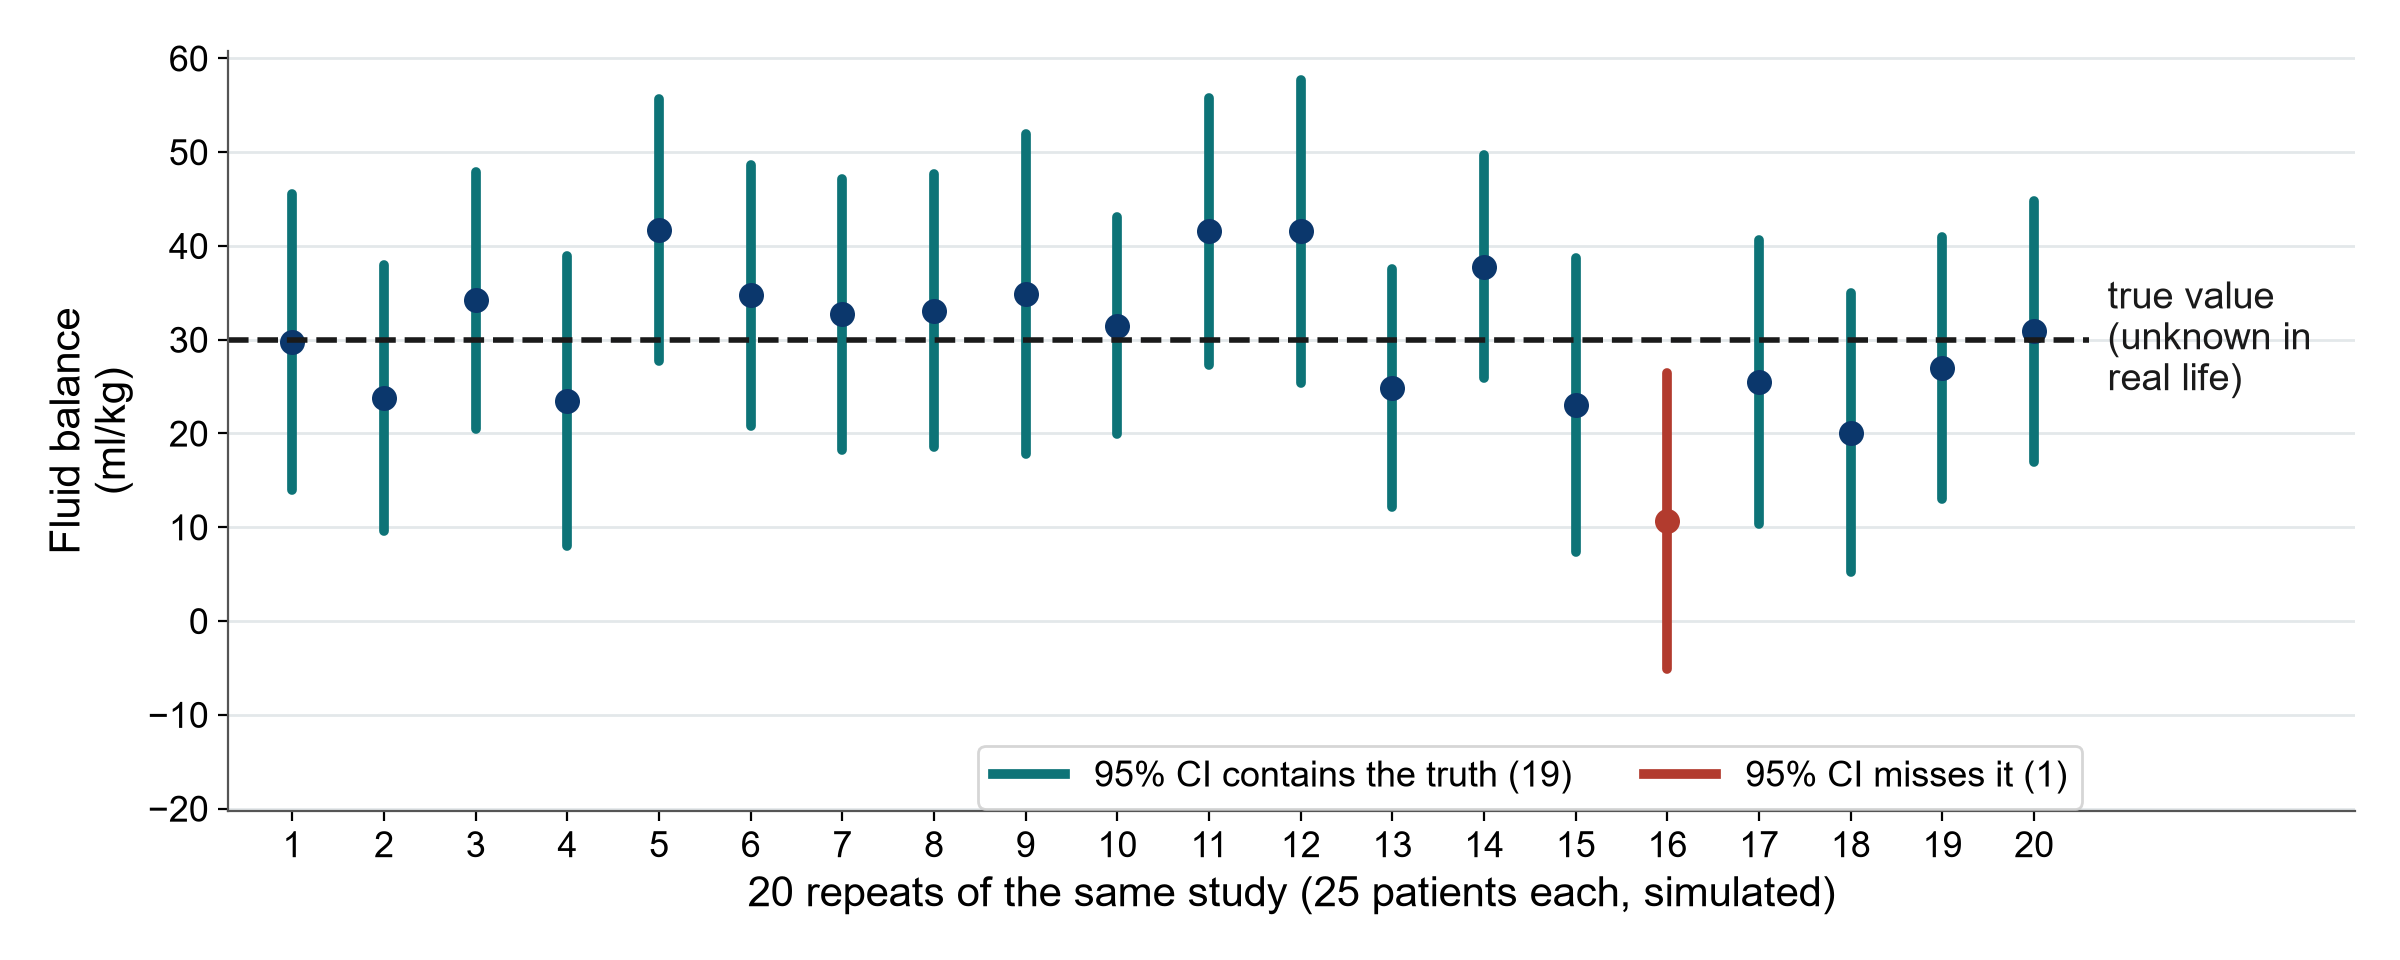
The dance of the confidence intervals

KEY MESSAGE About 95 of 100 such intervals capture the truth. We never know which ones.

The p-value in one picture
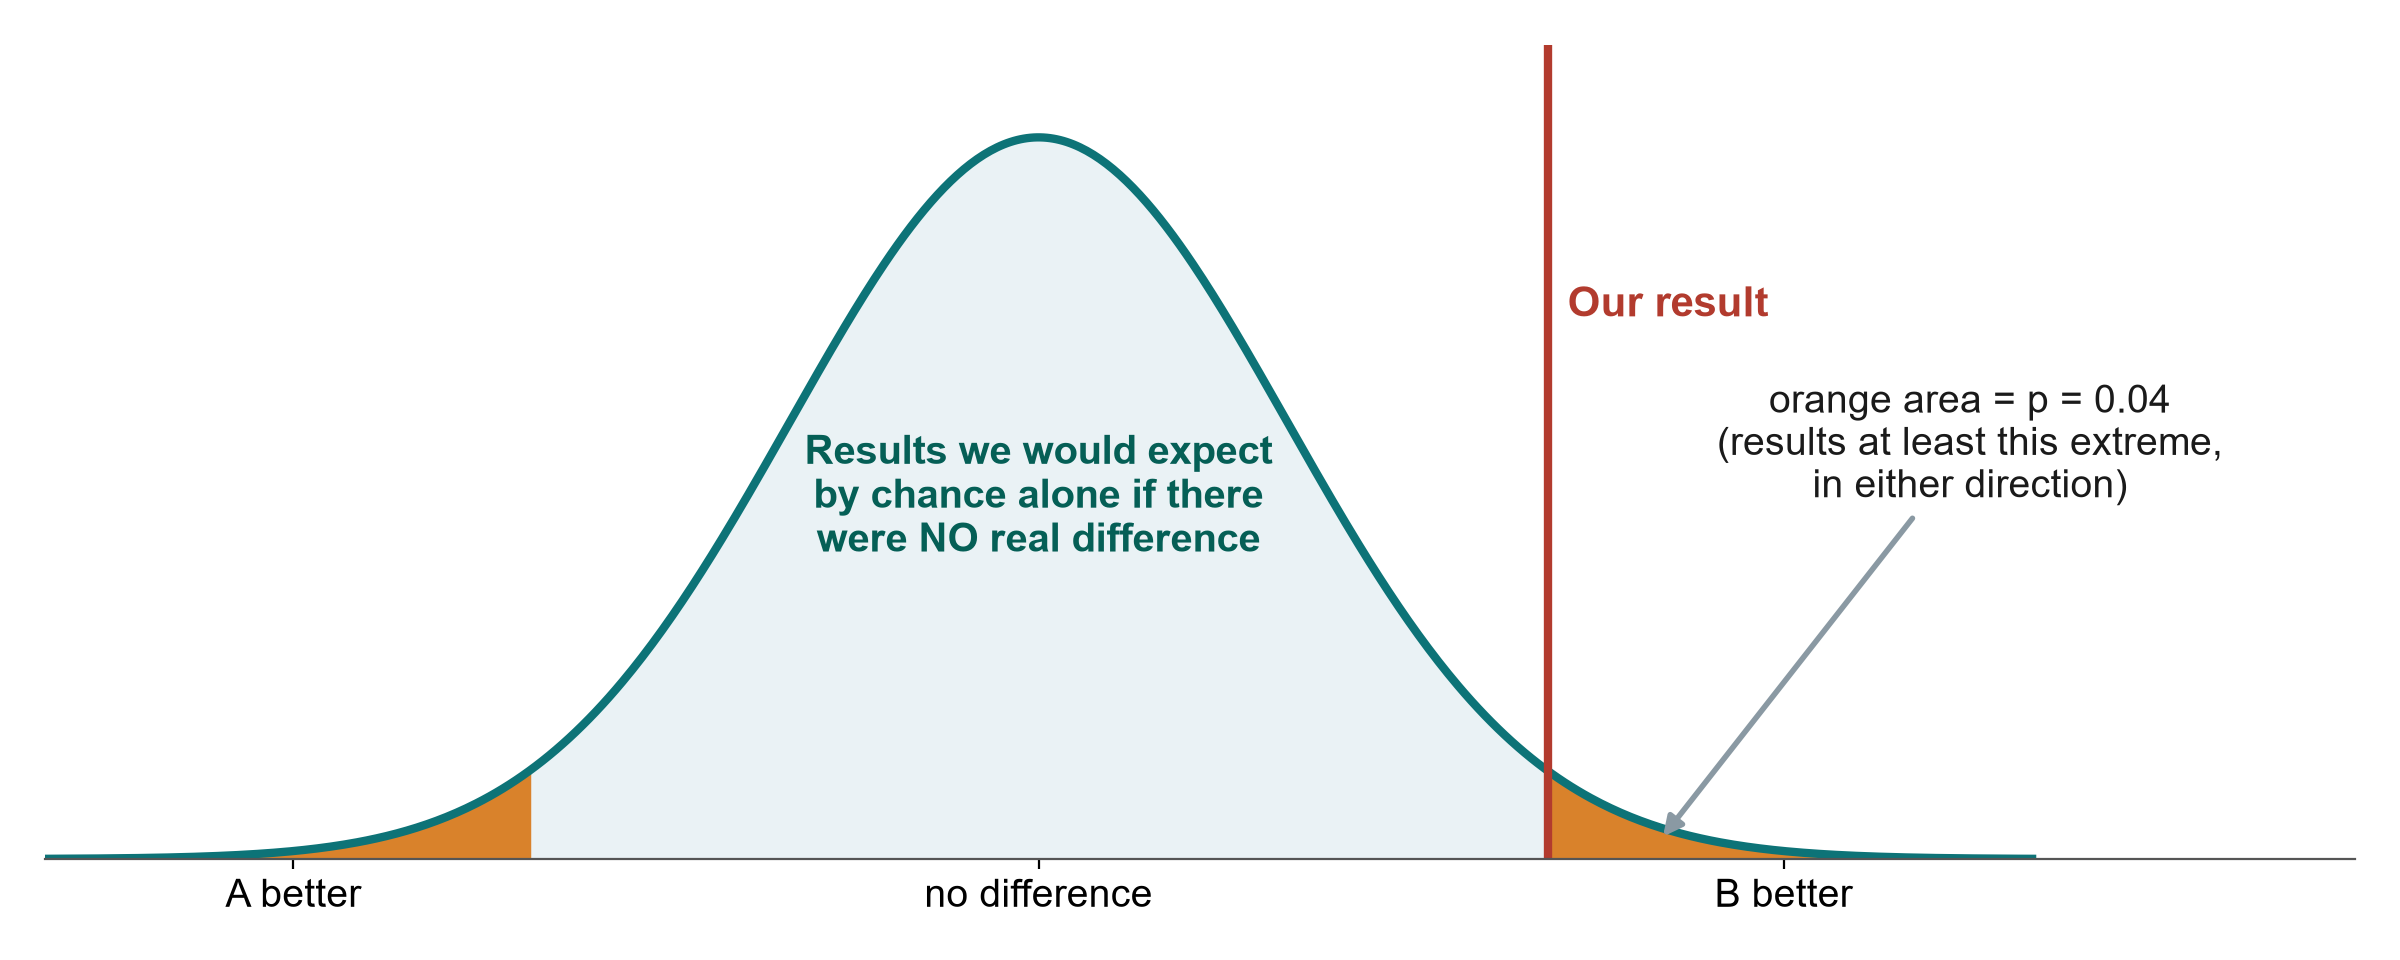
KEY MESSAGE p = how surprising our result would be if there were truly no difference.

One-sided or two-sided? Two-sided is the default

H0 (null hypothesis): no difference. H1 (alternative hypothesis): there is a difference. The direction of H1 decides which tails count.

Two-sided (the default)

  • H1: the groups differ, in either direction
  • Benefit and harm both count
  • The p-value uses both tails

One-sided (rarely justified)

  • H1: one direction only, e.g. ‘restrictive is better’
  • Needs a strong reason, written before the data
  • Same data give about half the p-value

Not non-inferiority

  • Non-inferiority is a different design
  • It has a margin set in advance (Session 3)
  • It needs its own sample size and analysis

KEY MESSAGE Use two-sided tests. A one-sided test chosen after seeing the data is not acceptable.

Five common p-value mistakes

Each of these sentences appears in published papers. All are wrong. (H0 = the null hypothesis: no difference.)

‘Chance of H0’

  • p is not the chance that there is no effect

‘Big effect’

  • A small p is not a big or important effect

‘No effect’

  • p > 0.05 is not proof of no effect

‘A trend’

  • p = 0.08 is not ‘almost significant’

‘Only p’

  • p alone is not enough
  • Give the effect and its 95% CI

KEY MESSAGE Report the effect size with its 95% CI. The p-value is a supporting actor.

Check your understanding: CI and p-value

QUICK QUIZ · 3 min

  • ‘Hazard ratio (HR) 2.13, 95% confidence interval (CI) 1.48 to 3.06’: the data are compatible with a true HR from about 1.5 to 3.1. True or false?
  • ‘p = 0.42, so the two strategies are equivalent.’ True or false?
  • ‘p = 0.03 means a 3% chance that there is no effect.’ True or false?
  • ‘A larger study usually gives a narrower CI.’ True or false?

Answers

  • True
  • False: we do not know
  • False: p assumes no effect
  • True

OUTPUT Everyone can read a CI and avoid the classic p-value mistakes

Type I and type II errors: the fire alarm

There is a fire (real effect) No fire (no real effect)
Alarm rings (p < 0.05, ‘significant’) Correct alarm: power (aim for 80-90%)
Alarm silent (p of 0.05 or more) Missed fire: type II error (beta)

Alpha = risk of a false alarm. Power = chance of detecting a real effect. A less sensitive alarm (smaller alpha) gives fewer false alarms but more missed fires, unless you buy a better alarm: more patients.

Sample size: bigger effect, less noise = fewer patients
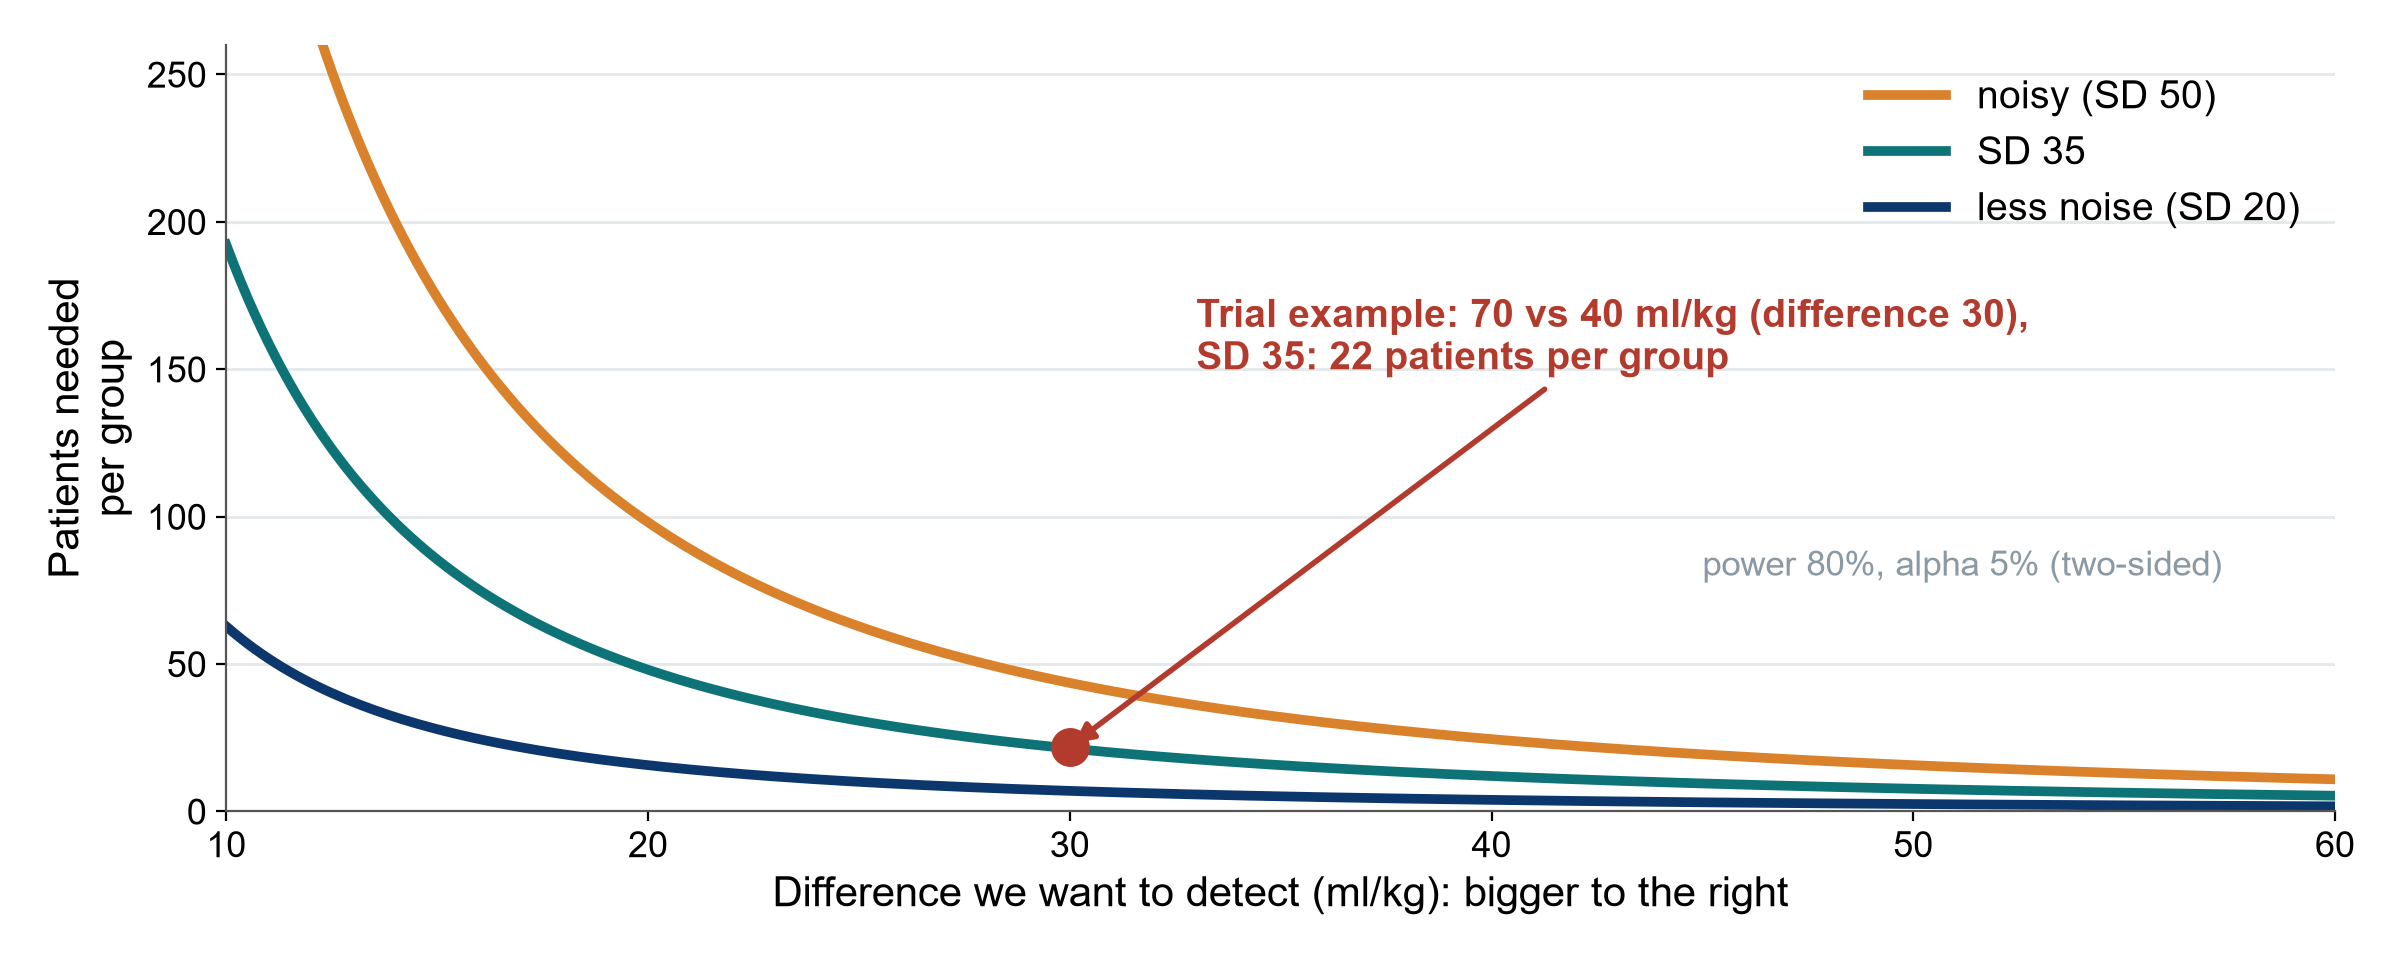
KEY MESSAGE Sample size depends on the effect you hope to detect and on the noise.

Live demo: an online sample-size calculator

LIVE DEMO · 5 min

  • Open a free online calculator (for example OpenEpi) on the shared screen
  • Two means: 70 vs 40 ml/kg, SD (standard deviation) 35, power 80%, alpha 5%: 22 per group
  • Two proportions: mortality 40% vs 30%: about 356 per group
  • Change one input at a time. Predict the direction first (poll)
  • Offline fallback: the Neudata sample-size spreadsheet

What changes n?

  • Smaller effect: n goes up
  • More noise (SD): n goes up
  • More power: n goes up
  • Add 10-20% for drop-outs

OUTPUT Everyone knows the 4 numbers needed for their own sample-size statement

Choosing a test: one decision table

Outcome Shape or counts Two independent groups Same patients twice (paired)
A number (continuous) Roughly symmetric t-test Paired t-test
A number (continuous) Skewed, or small sample Mann-Whitney U Wilcoxon signed-rank
A category (yes/no) Expected counts 5 or more Chi-square McNemar
A category (yes/no) Small counts (under 5) Fisher’s exact McNemar

Outcome type + shape + paired or not = the right test. Paper 1 (Boulet 2024) used Mann-Whitney because fluid balance was skewed.

Paired or unpaired? Same patients or different patients
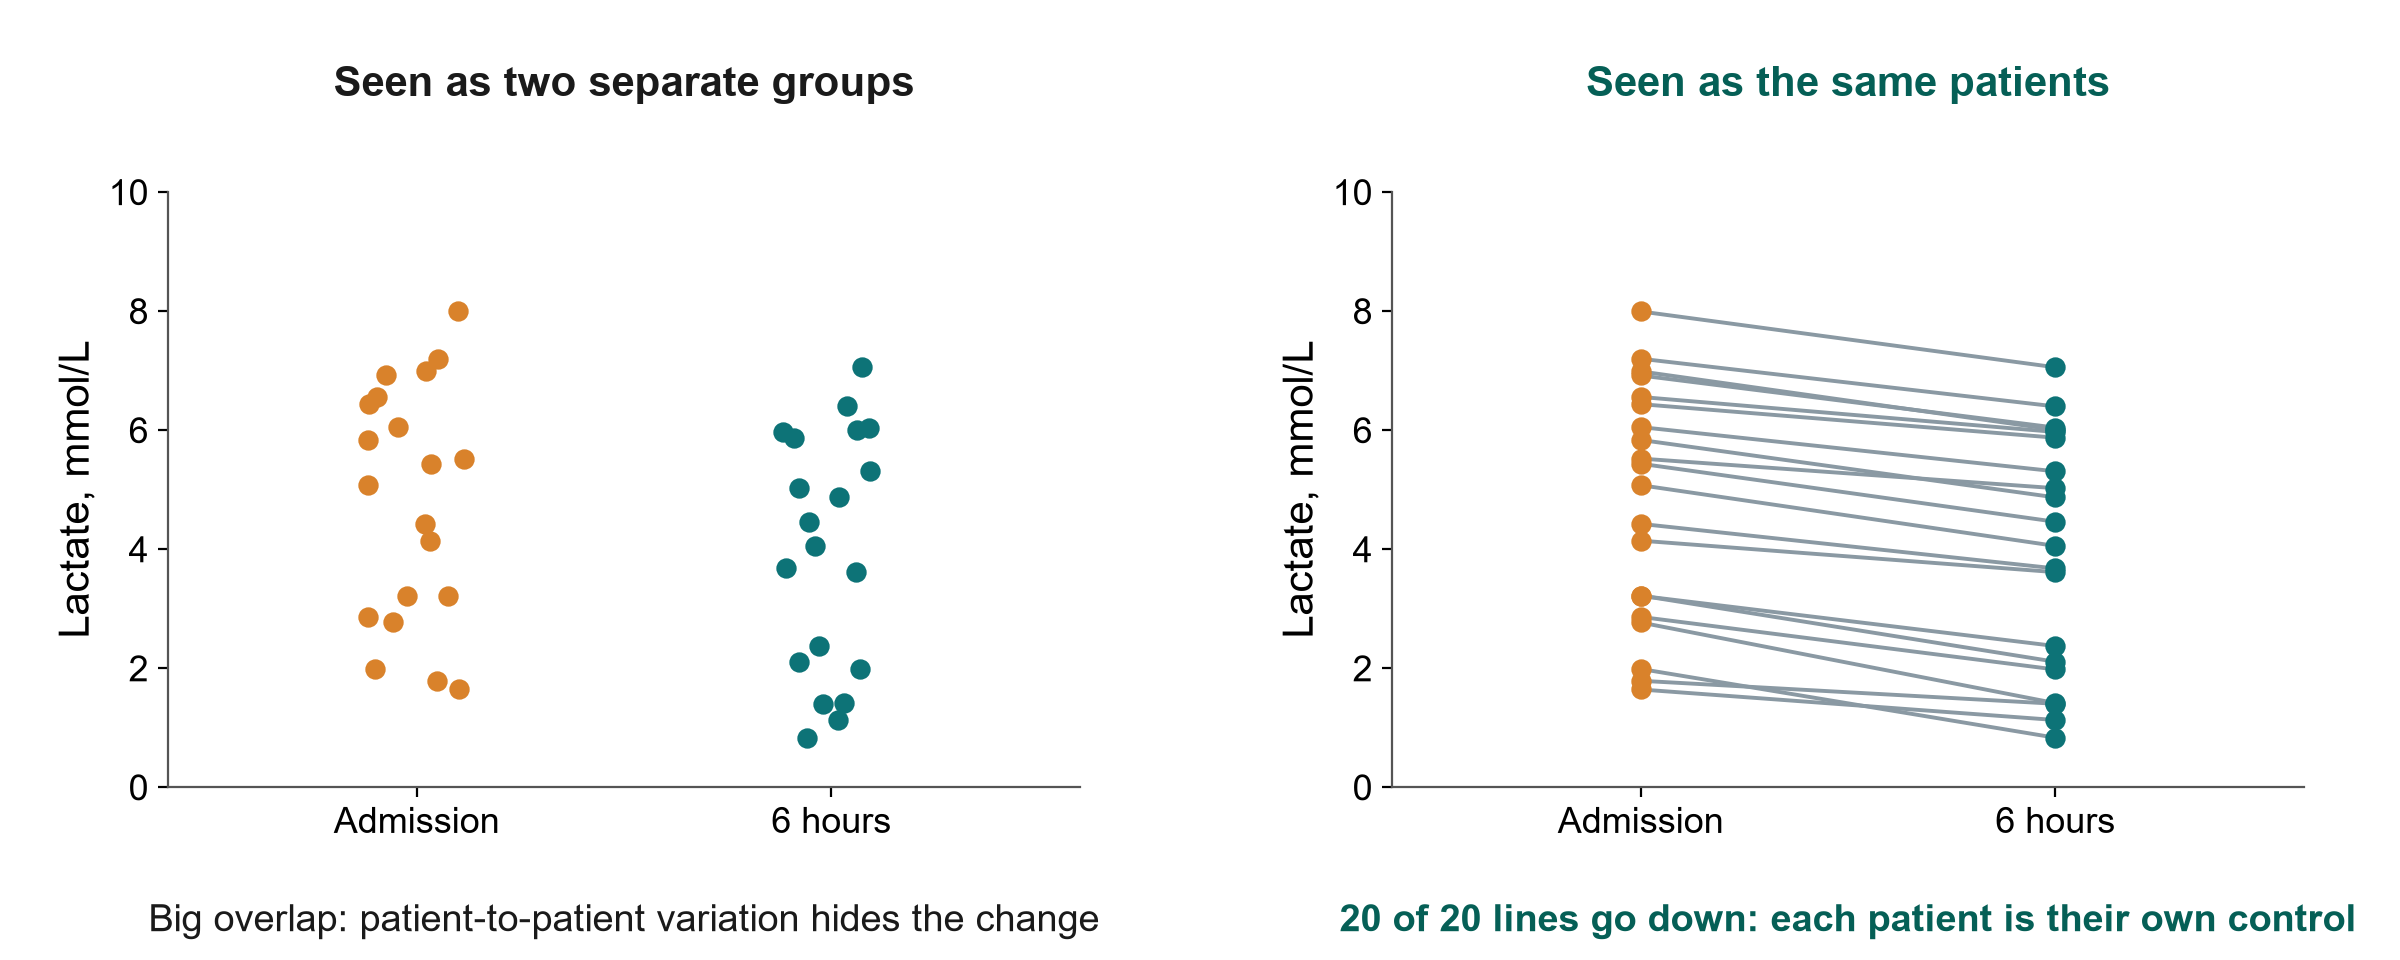
KEY MESSAGE Same patients measured twice = paired test. Different patients = unpaired.

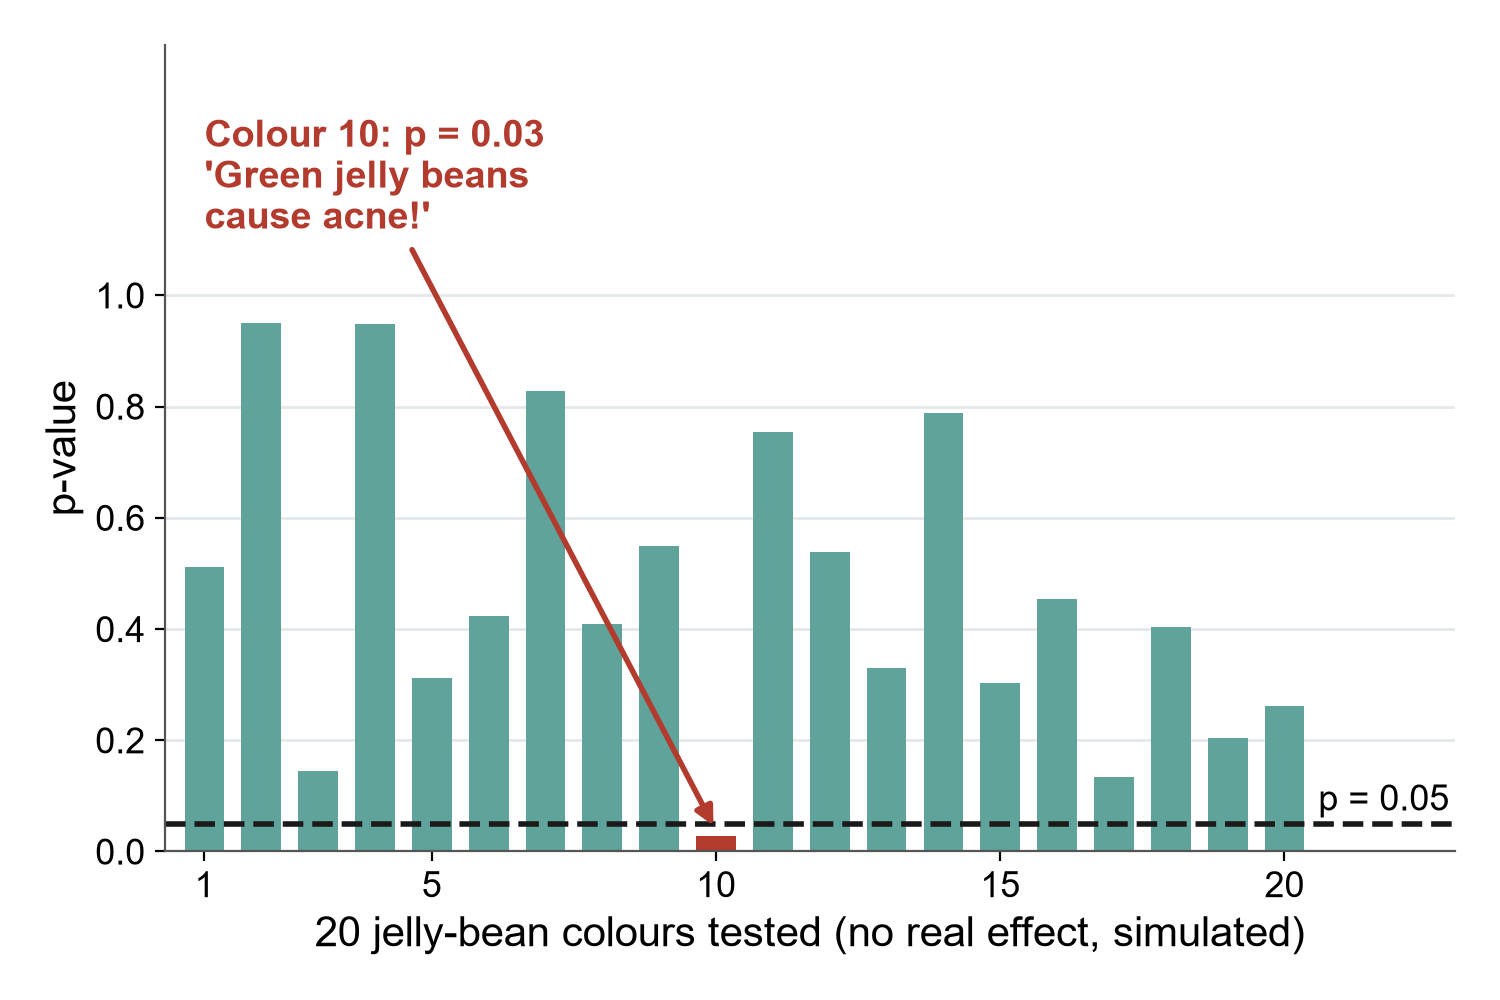
Multiple comparisons: the jelly-bean problem

What to do

  • Pre-specify one primary outcome
  • Label the rest as exploratory
  • Adjust, e.g. Bonferroni: 0.05 / number of tests
  • Report every test you ran

KEY MESSAGE Test 20 things and one will be ‘significant’ by chance alone.

Check your understanding: which test?

QUICK QUIZ · 3 min

  • ICU stay (skewed) in positive vs negative fluid balance groups
  • 28-day death (yes/no) in 300 vs 300 patients
  • Lactate at admission and 6 h later in the same 40 patients
  • Dialysis (yes/no): 2 of 24 vs 5 of 24 patients

Answers

  • Mann-Whitney U
  • Chi-square
  • Paired t-test
  • Fisher’s exact

OUTPUT Everyone can use the decision table

6.2 Compare groups in the course dataset

Choose the test from the outcome, then read the result as an effect with a CI.

6.2 Compare groups in the course dataset | 20 minutes

Live demo: comparing two groups in R

LIVE DEMO · 6 min

  • Open 03_compare.R
  • Age (symmetric): t-test
  • SOFA and lactate (skewed): Mann-Whitney
  • 28-day death (yes/no): 2x2 table and chi-square
  • The common mistake: a t-test on skewed ICU stay

Decision table

  • Number or category?
  • Symmetric or skewed?
  • Paired or not?
  • Effect + 95% CI

OUTPUT Everyone has seen the test chosen from the outcome type

FLUID-ICU: four outcomes, four comparisons

Outcome (type) Negative balance (n = 245) Positive balance (n = 373) Test Result
28-day death (yes/no) 45 (18.4%) 134 (35.9%) Chi-square Risk difference 17.6 points (95% CI 10.7 to 24.4), p < 0.001
Acute kidney injury (yes/no) 71 (29.0%) 230 (61.7%) Chi-square p < 0.001
Ventilator-free days (0-28, skewed) Median 28 (22 to 28) Median 20 (0 to 28) Mann-Whitney p < 0.001
ICU stay in survivors (days, skewed) 4.8 (3.3 to 7.1), n = 200 7.5 (5.2 to 11.2), n = 239 Mann-Whitney Difference 2.5 days (95% CI 1.8 to 3.2), p < 0.001

n (%) or median (IQR). Unadjusted comparisons, simulated data (key_results.md). Every outcome is worse in the positive-balance group, before any adjustment.

Worked example: reading the mortality comparison

Question 1 (Q1), unadjusted: positive vs negative fluid balance by day 3.

Risks

  • Positive: 134/373 = 35.9%
  • Negative: 45/245 = 18.4%

Difference

  • 17.6 percentage points
  • 95% CI 10.7 to 24.4

Ratio

  • Risk ratio (RR) 1.96
  • About twice the risk

Test

  • Chi-square, p < 0.001

But…

  • Unadjusted: the positive group was sicker

KEY MESSAGE Report the effect and its CI. Then ask what else could explain it.

Interpret the comparisons together

WHOLE-CLASS TASK · 7 min

  • Q1 in full: 28-day death in the comparison table of the Q1 results pack (PDF)
  • Poll: which test was used, and why that test?
  • Question for the class: say the result as an effect with its 95% CI. The instructor builds one Results sentence
  • Question for the class: one reason the comparison could be biased
  • Q2 to Q5: the instructor reads each result in one sentence

Avoid

  • p-value alone
  • ‘proves’, ‘causes’
  • ‘trend’ for p > 0.05
  • Forgetting the n

OUTPUT One Results sentence for Q1, one line each for Q2 to Q5 (Exercise 4)

Break

15 min

6.3 Relationships and models (concepts)

You do not need to run a model to read one.

6.3 Relationships and models | 35 minutes

Correlation: how closely two numbers move together
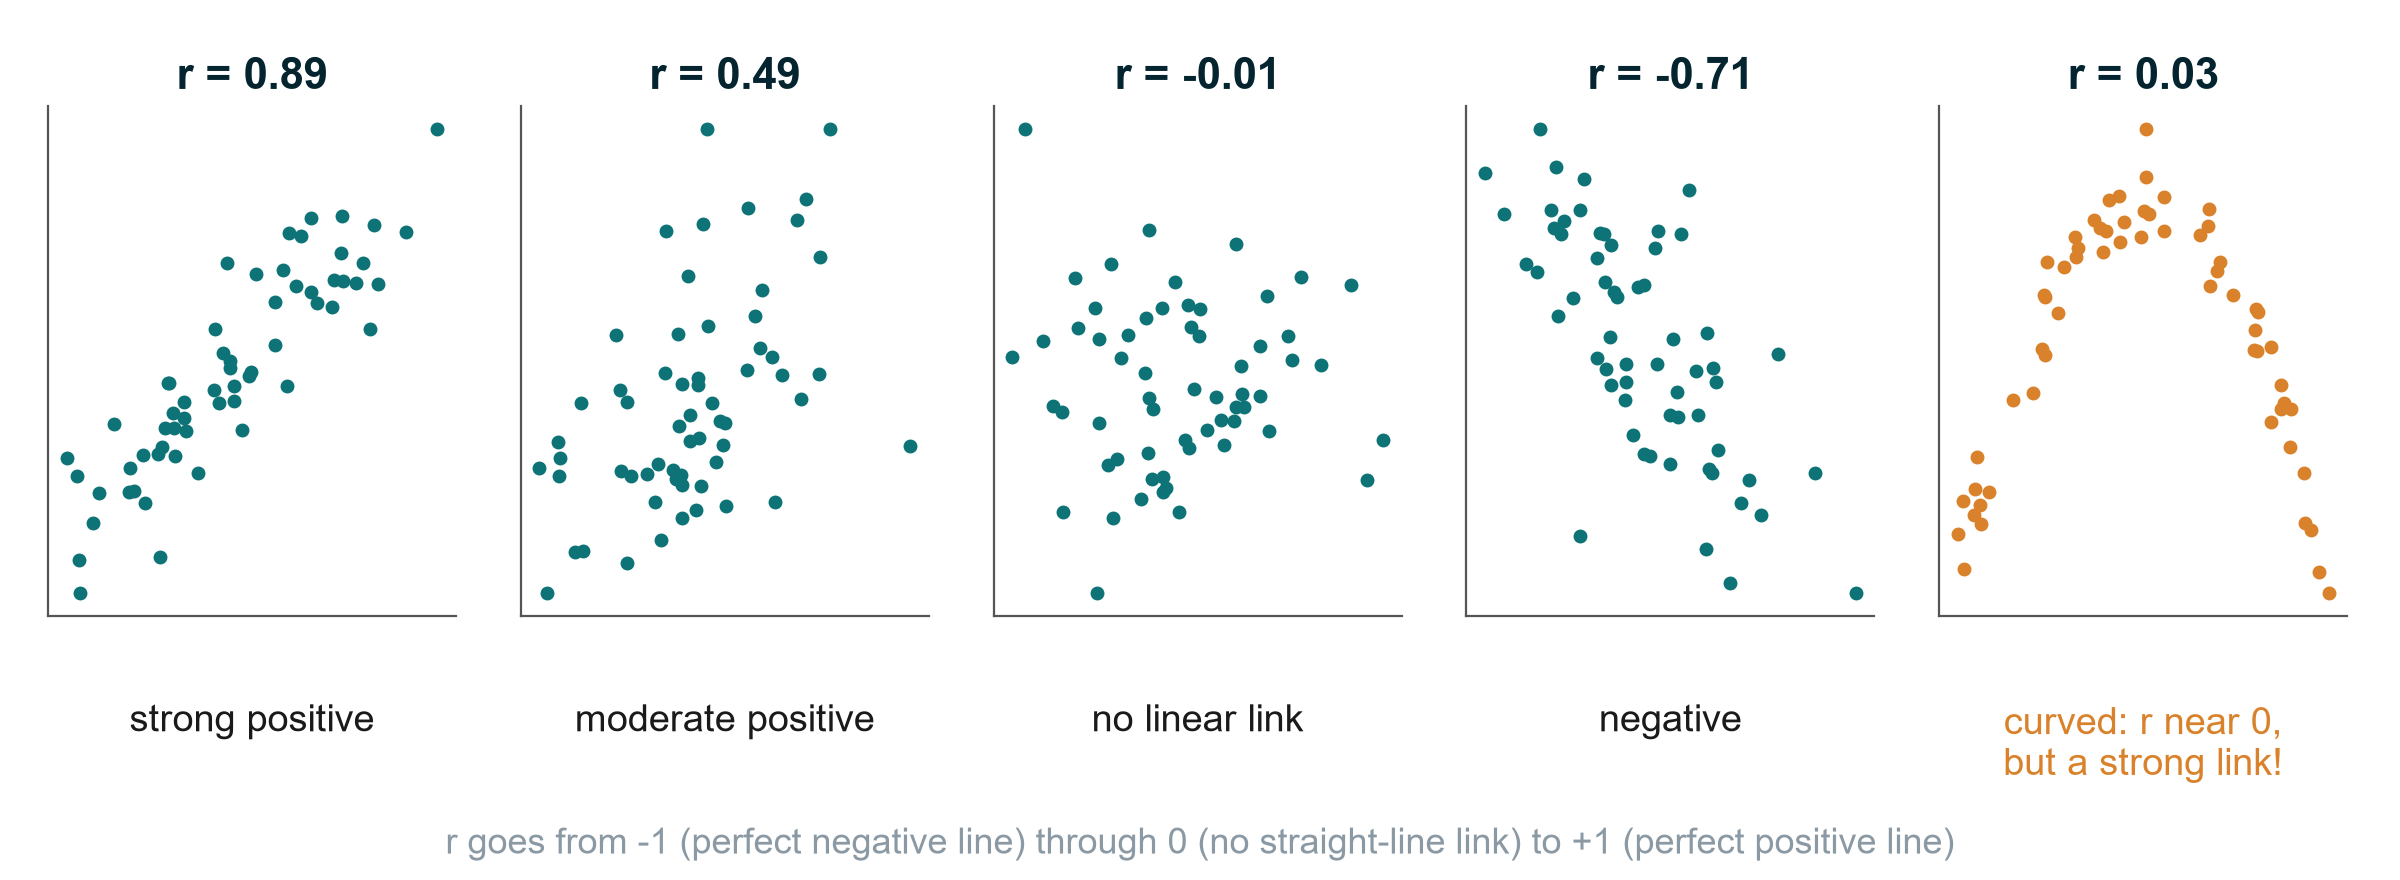
KEY MESSAGE r measures straight-line association, from -1 to +1. Always look at the plot.

Linear regression: the best straight line
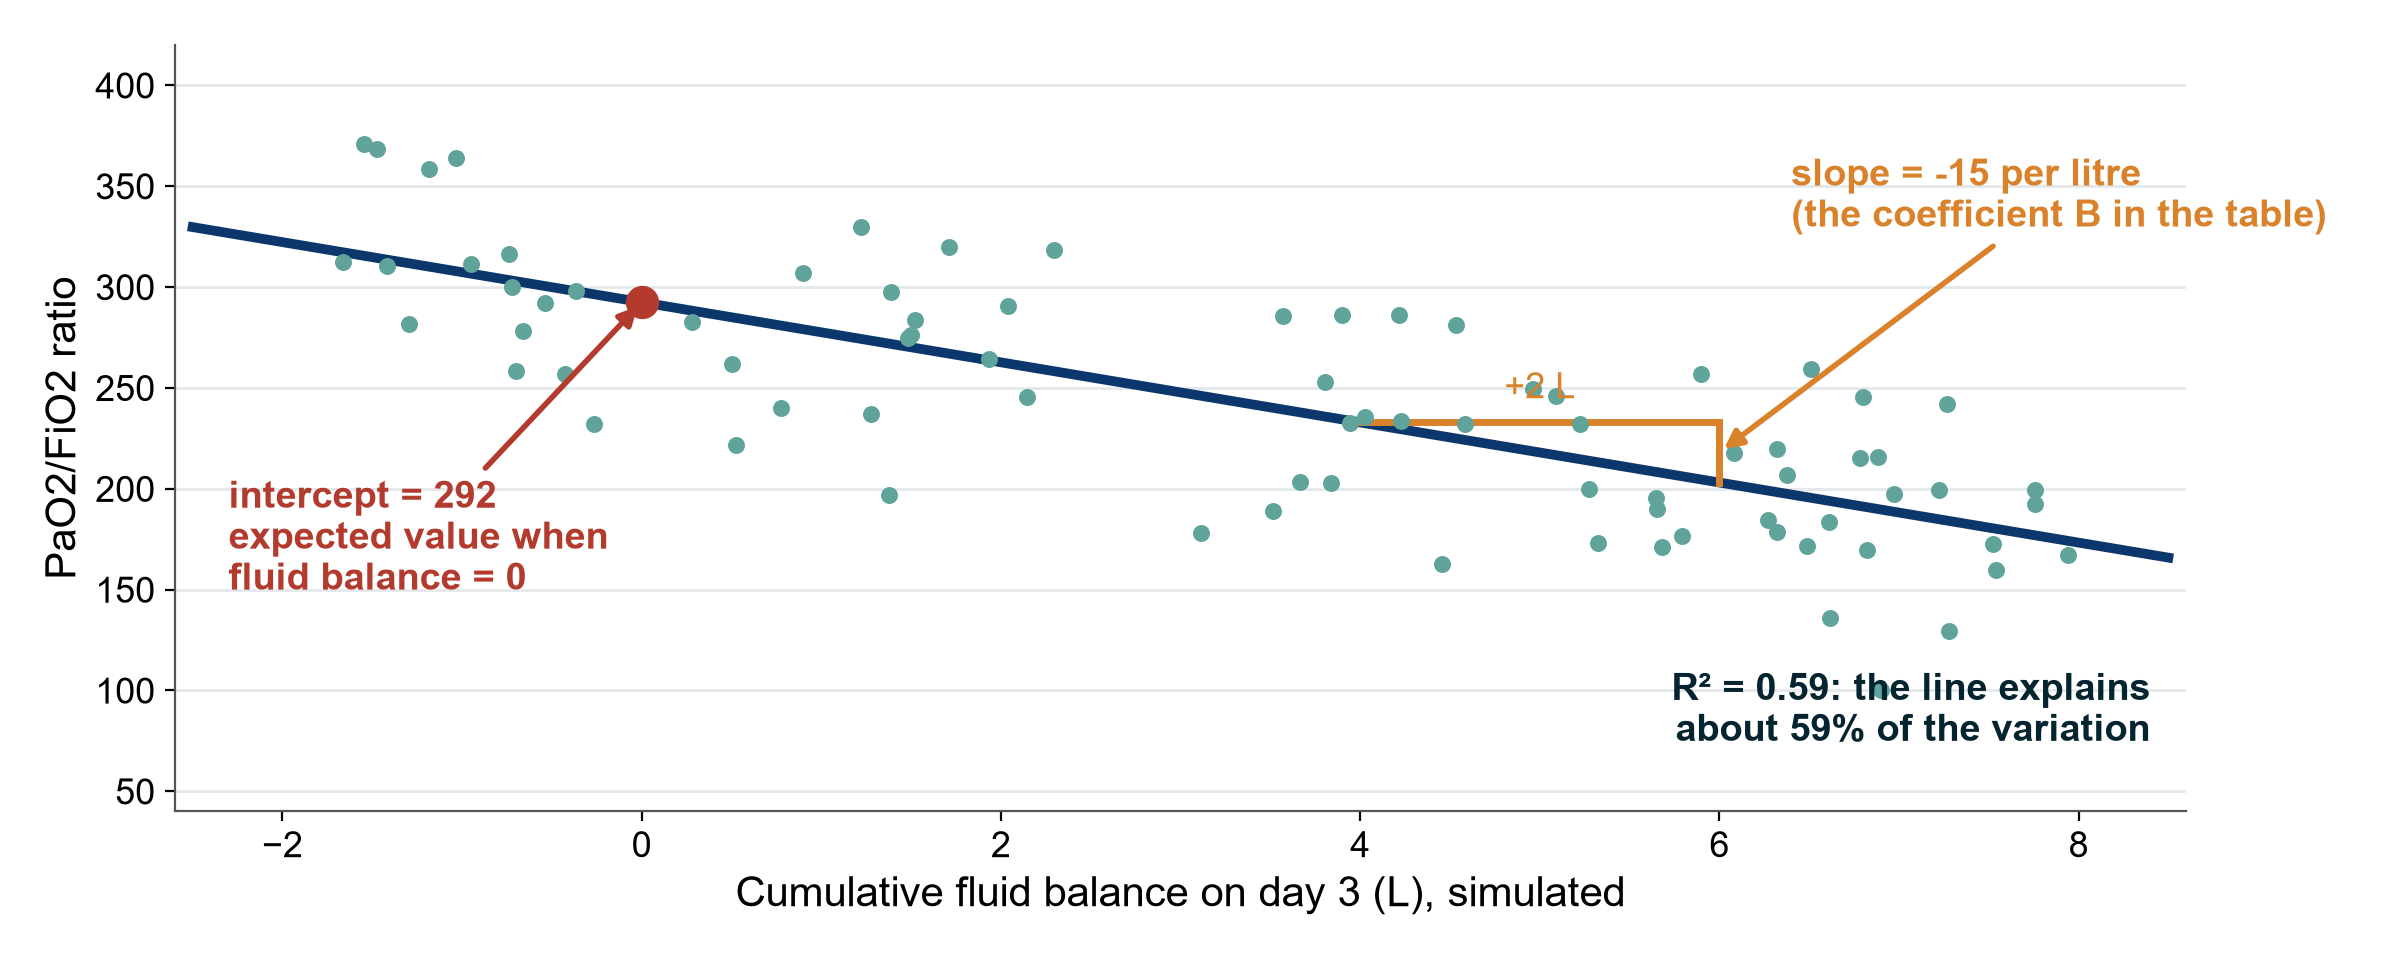
KEY MESSAGE Slope = change in the outcome per unit of exposure. R² = how much the line explains.

Logistic regression: an S-curve for yes/no outcomes
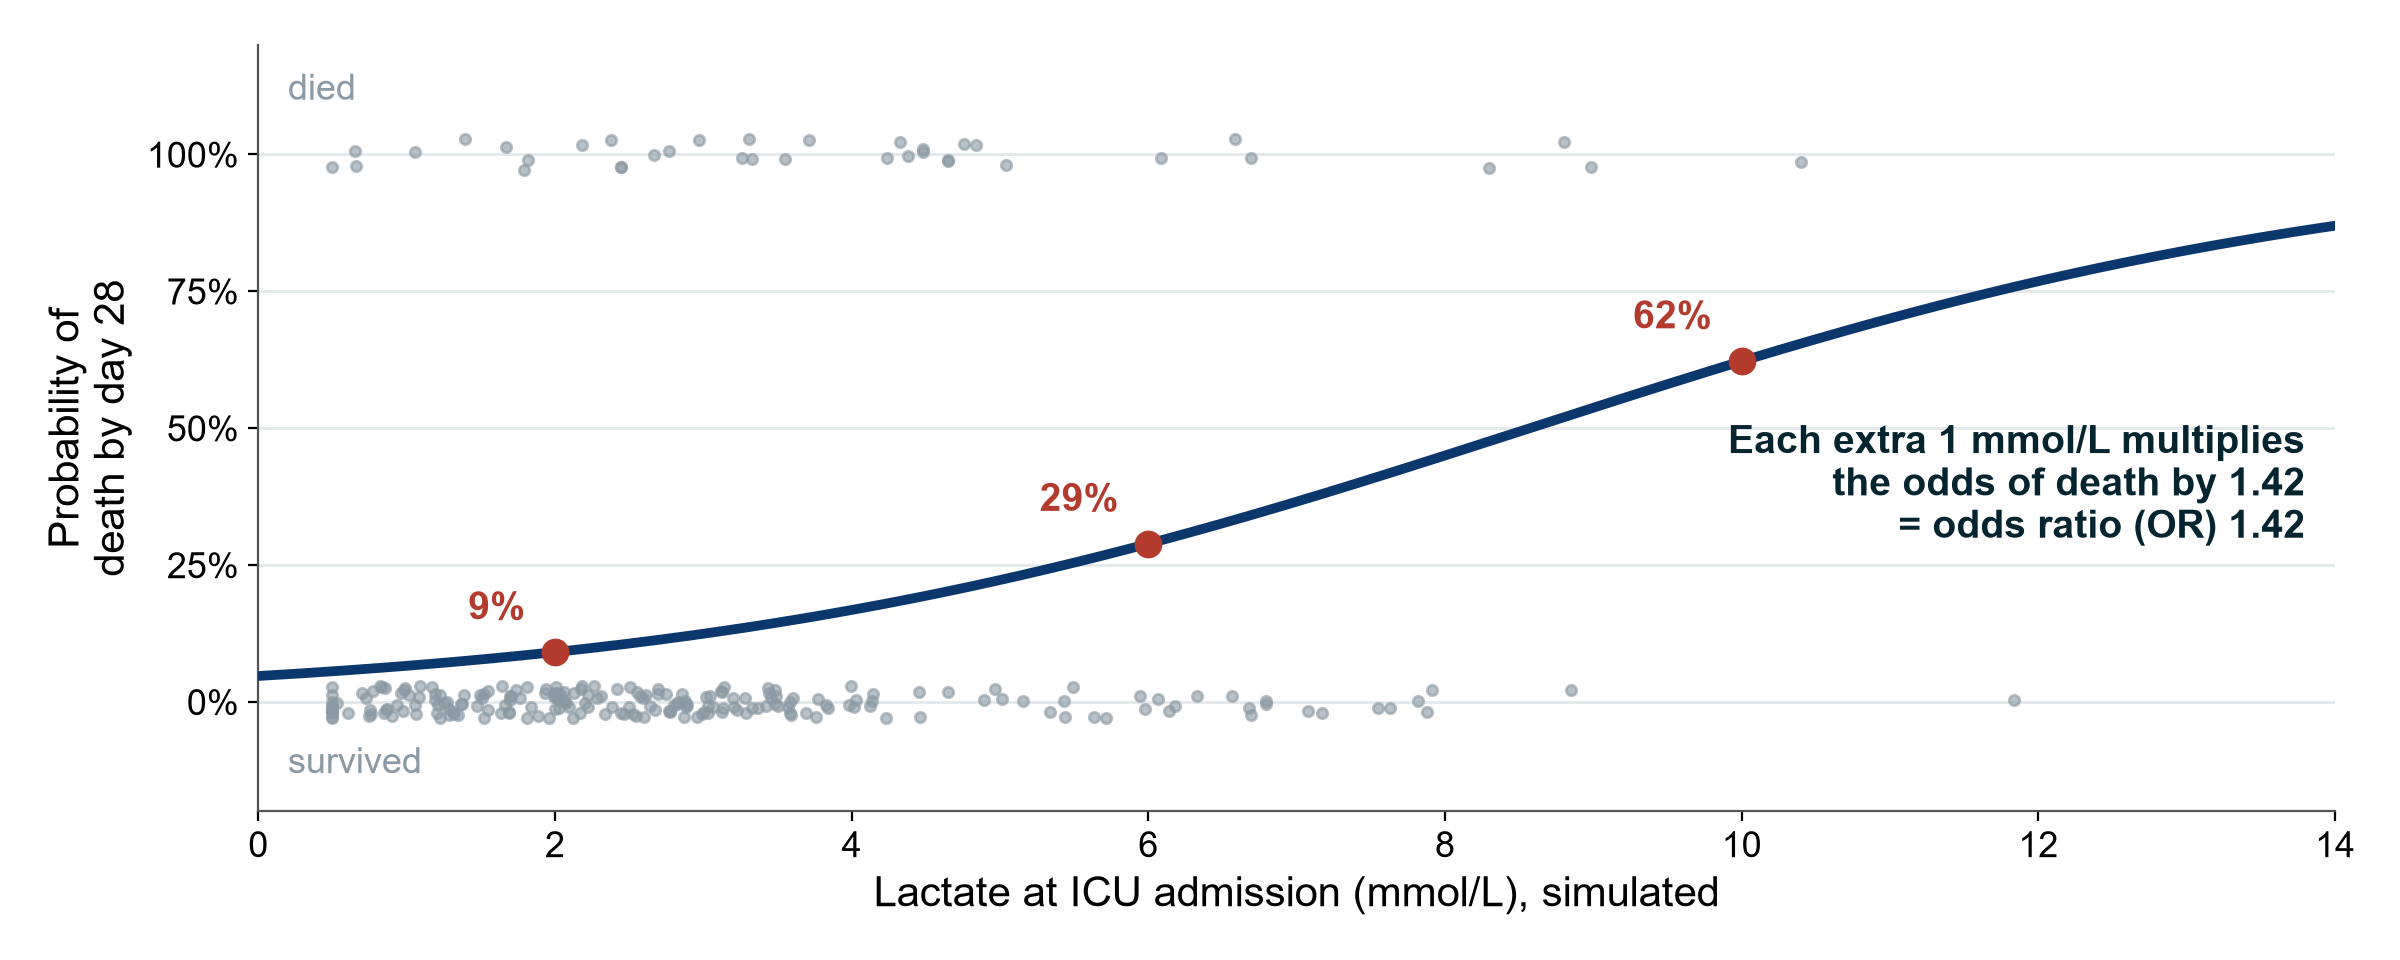
KEY MESSAGE Logistic regression turns a yes/no outcome into an odds ratio per unit of exposure.

Which model? It depends on the outcome

Your outcome is… Model The paper reports ‘No effect’ value
A number, e.g. fluid balance (ml/kg) Linear regression Coefficient (B): a difference 0
Yes / no, e.g. died by day 28 Logistic regression Odds ratio (OR) 1
Time to event, e.g. time to death Cox regression Hazard ratio (HR) 1

The outcome type tells you the model and the number to read.

What ‘adjusted’ means: compare like with like
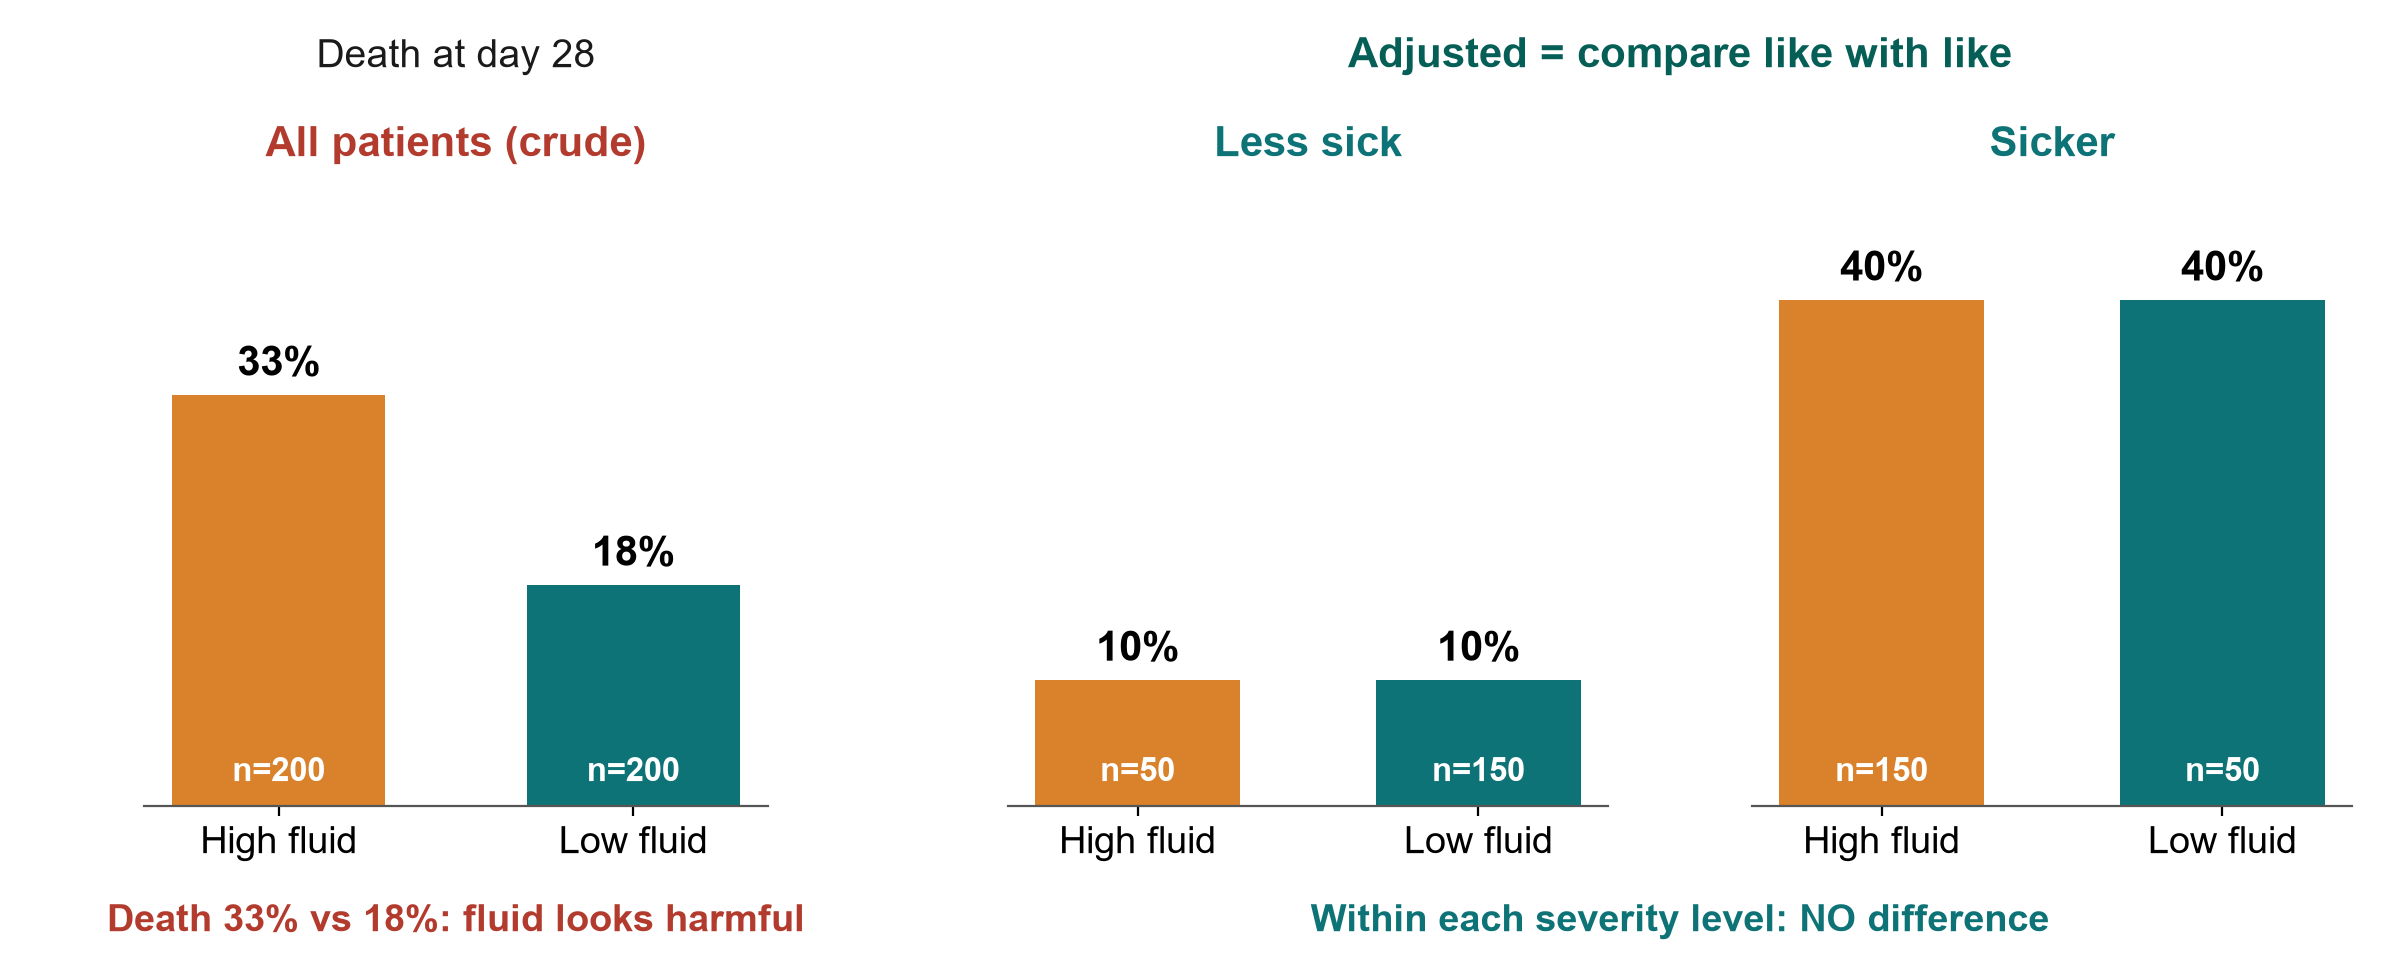
Simulated numbers

KEY MESSAGE Adjusting = comparing patients who are alike on the confounders.

Reading a regression table, row by row

Variable Adjusted OR 95% CI p-value Does the CI include 1?
Positive fluid balance (yes vs no) 1.80 1.20 to 2.70 0.004 No
Age (per 10 years) 1.25 1.10 to 1.42 < 0.001 No
SOFA score (per 1 point) 1.15 1.08 to 1.23 < 0.001 No
Female (vs male) 0.92 0.65 to 1.30 0.64 Yes: compatible with no effect
Lactate (per 1 mmol/L) 1.10 0.98 to 1.24 0.11 Yes: compatible with no effect

Outcome: death by day 28. Multivariable logistic regression, mock data. The rows below row 1 are the confounders the authors ‘adjusted for’. Read each row: comparison, effect, 95% CI, does the CI include 1?

Check your understanding: read the regression table

QUICK QUIZ · 4 min

  • Use the table on the previous slide (‘Reading a regression table’)
  • Poll: for female sex, does the 95% CI include 1? What does that mean?
  • Poll: what does ‘OR 1.15 per SOFA point’ mean?
  • Question for the class: one plain-language sentence for positive fluid balance
  • Extra practice at home: Exercises 5 and 6 of the exercise sheet

The 4-step reading

  • What is compared?
  • How big is the effect?
  • How wide is the CI?
  • Does it cross 1 (or 0)?

OUTPUT One correct plain-language sentence, agreed by the class

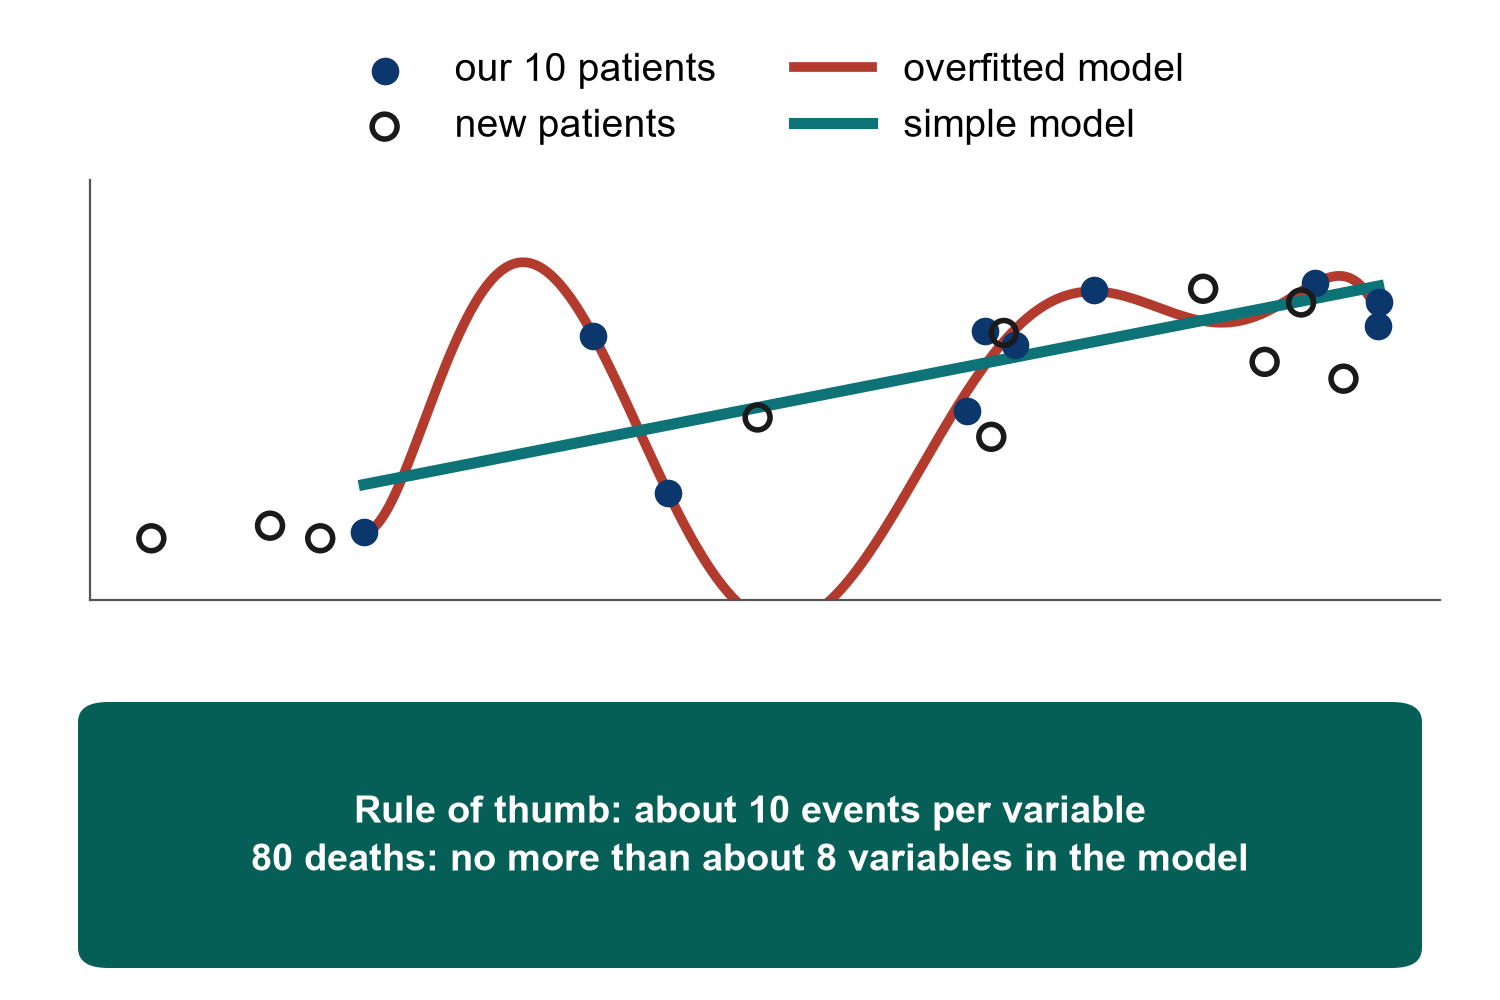
Overfitting: too many variables for too few events

Why stepwise misleads

  • Picks variables by p-value
  • Finds chance ‘predictors’
  • Effects too big, CIs too narrow
  • Better: choose confounders in advance

KEY MESSAGE Plan about 10 events per variable and choose variables by knowledge, not p-values.

Survival analysis starts with censoring
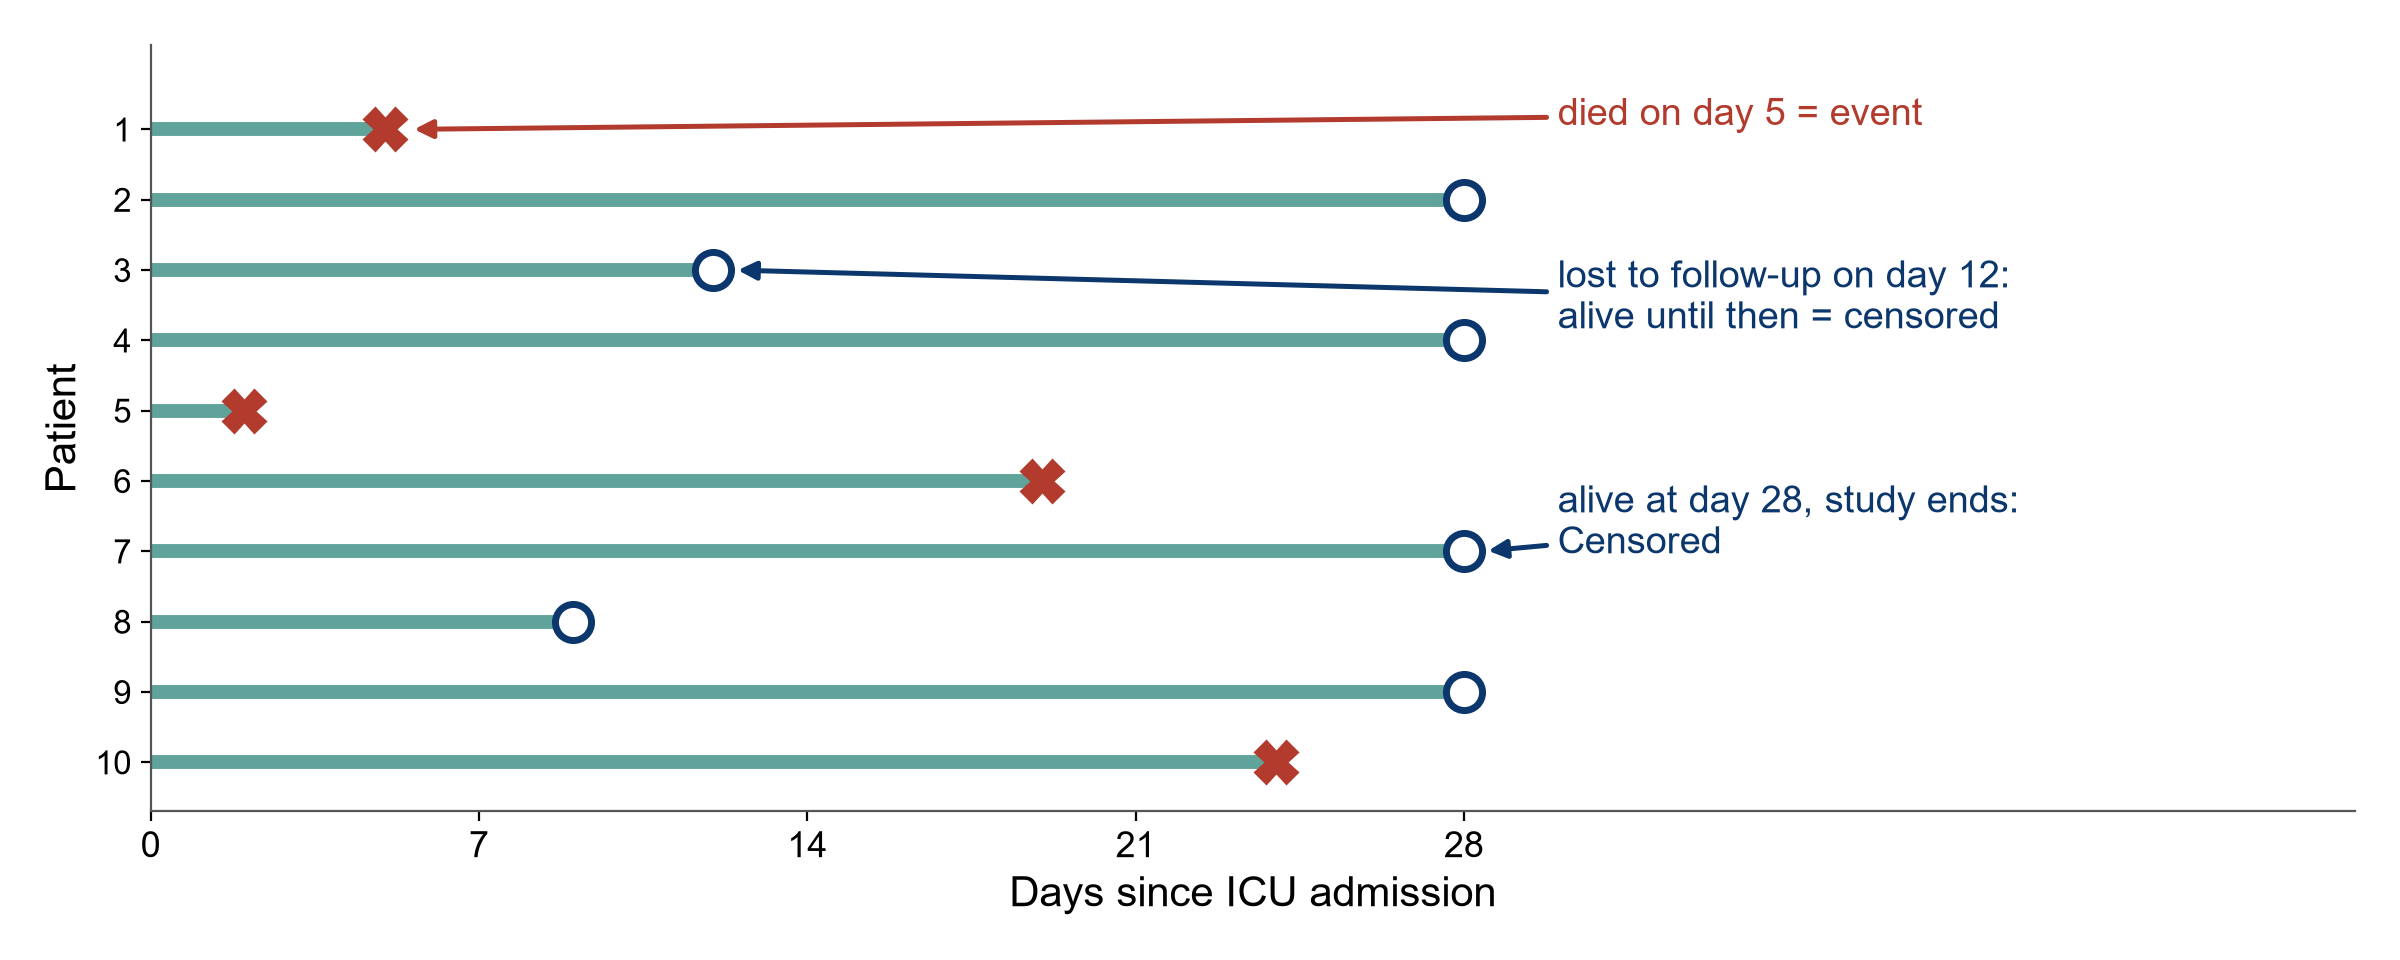
KEY MESSAGE Censored patients still count: they tell us they survived up to that day.

How to read a Kaplan-Meier curve
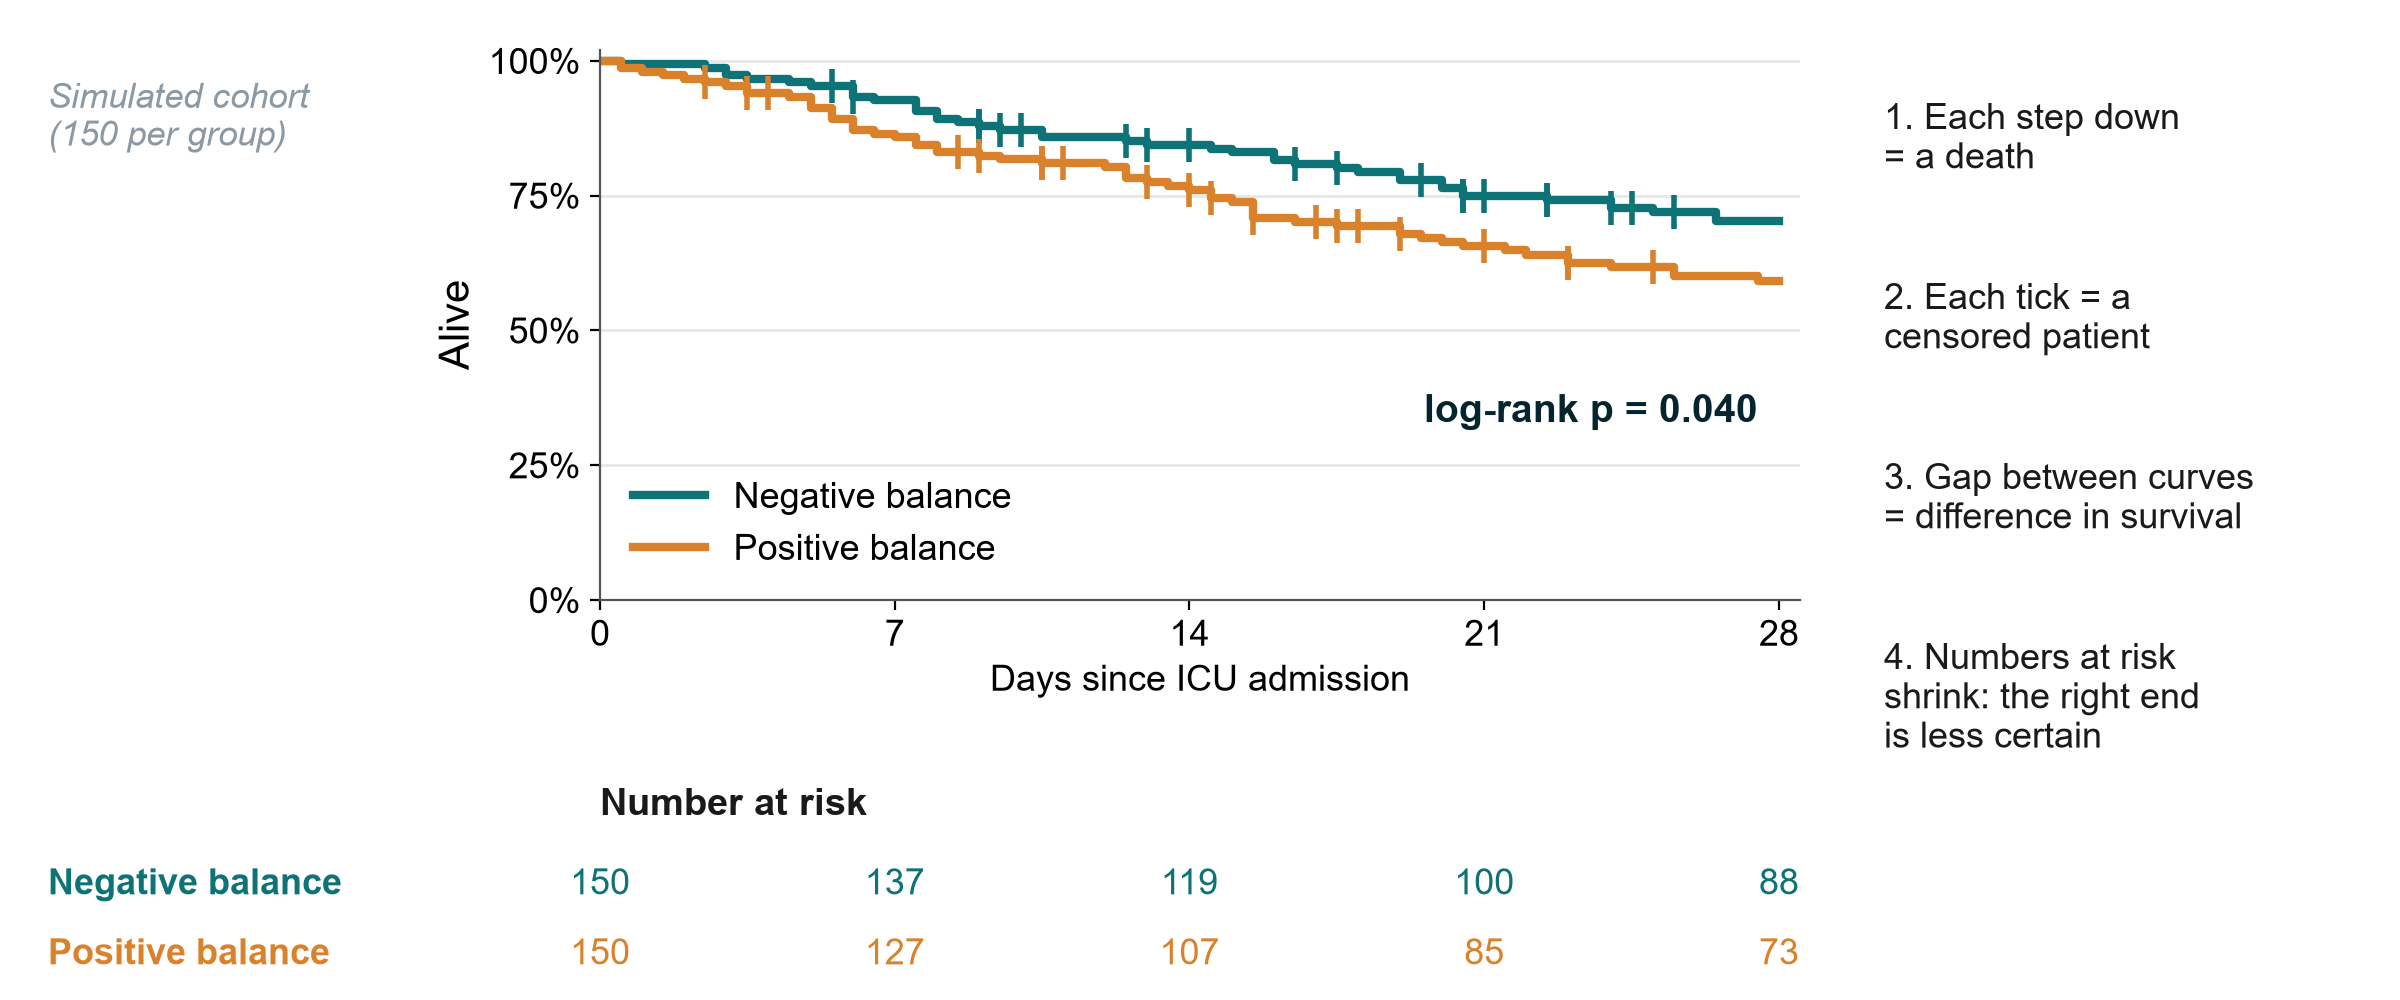
KEY MESSAGE Read the steps, the ticks, the gap, and always the numbers at risk.

6.4 Model the course dataset

Adjust for what you planned, read the CI, and be honest about the gaps.

6.4 Model the course dataset | 25 minutes

The SAP came first

The statistical analysis plan (SAP) was signed before the database was locked.

Primary

  • 28-day death
  • Logistic regression, odds ratio (OR)

Confounders

  • Age, SOFA, lactate
  • Vasopressor, ventilation
  • Chronic kidney disease (CKD)

Supportive

  • Kaplan-Meier and log-rank test
  • Cox hazard ratio (HR)

Subgroup

  • One pre-specified: heart failure

Missing data

  • Complete-case analysis
  • Multiple imputation

KEY MESSAGE Everything on the next slides was decided before anyone saw the results.

Confounding by indication, made visible
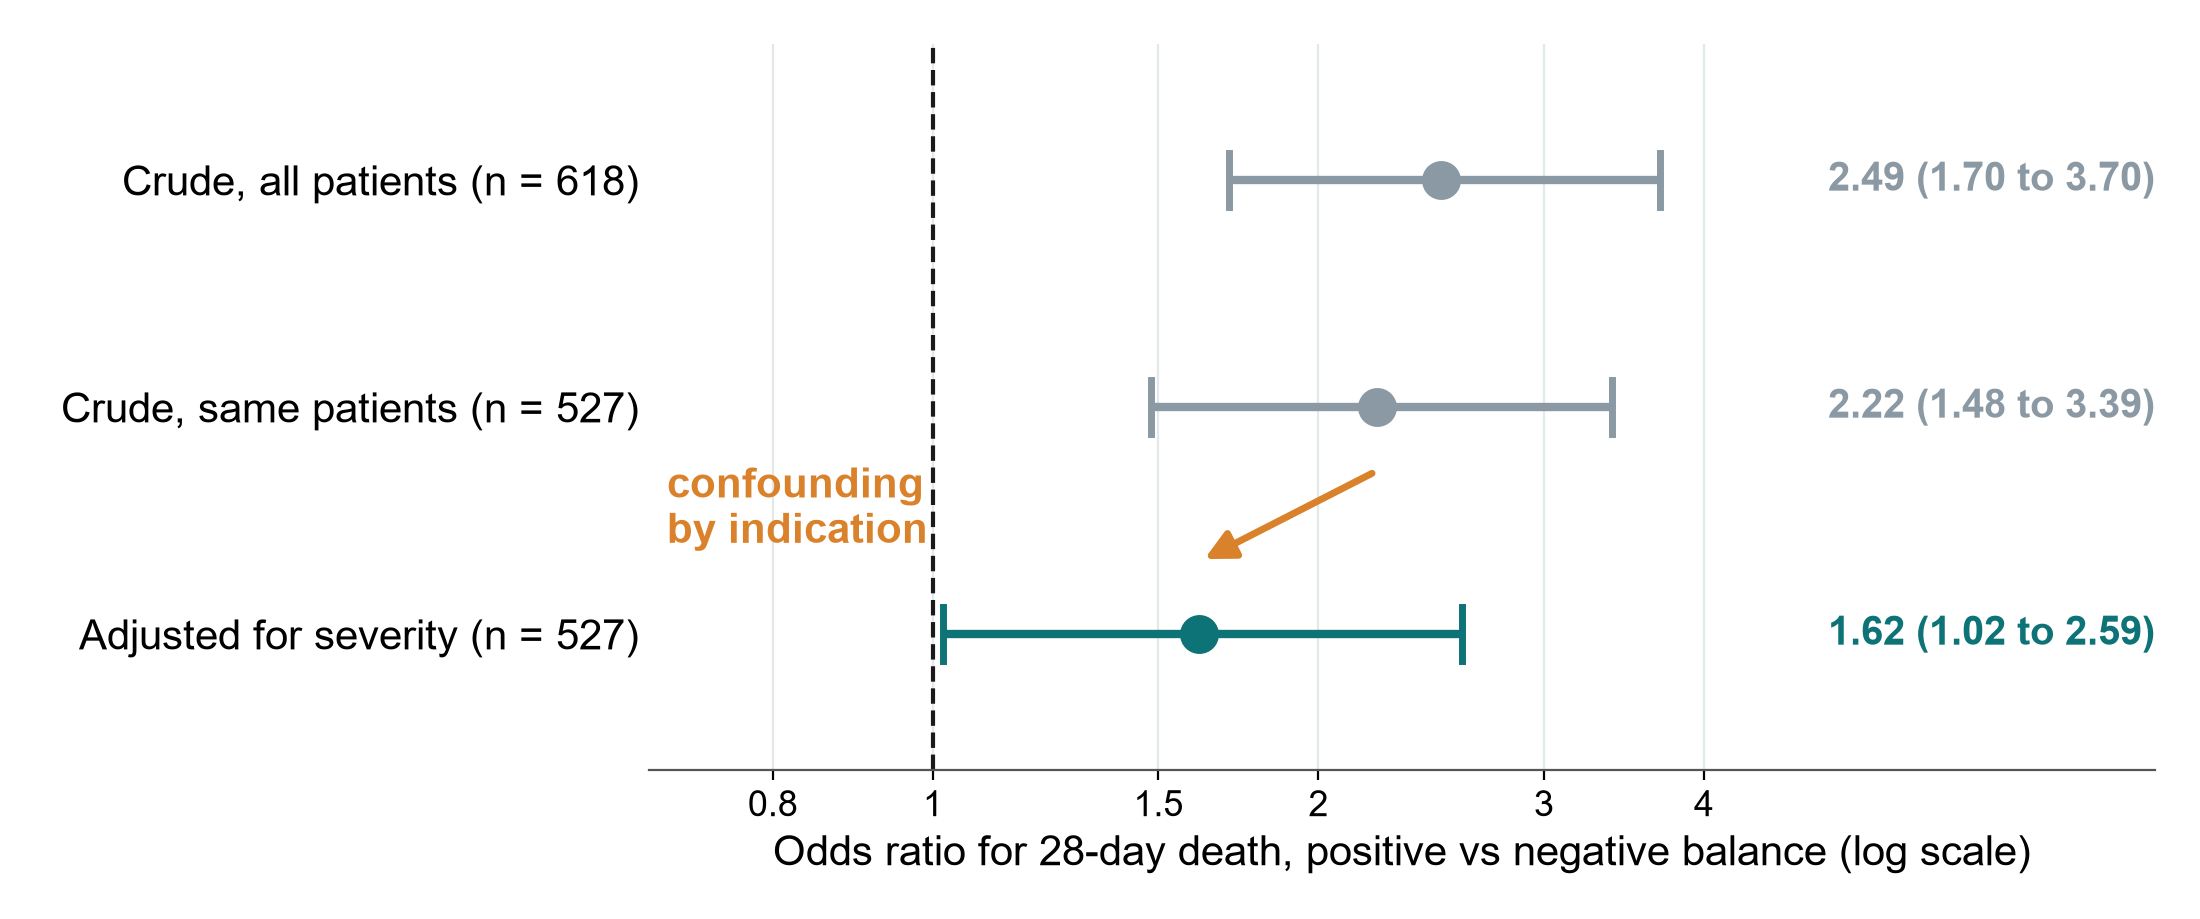
KEY MESSAGE Crude OR 2.49 shrinks to 1.62 after adjusting for severity: still above 1.

The adjusted model, as a forest plot
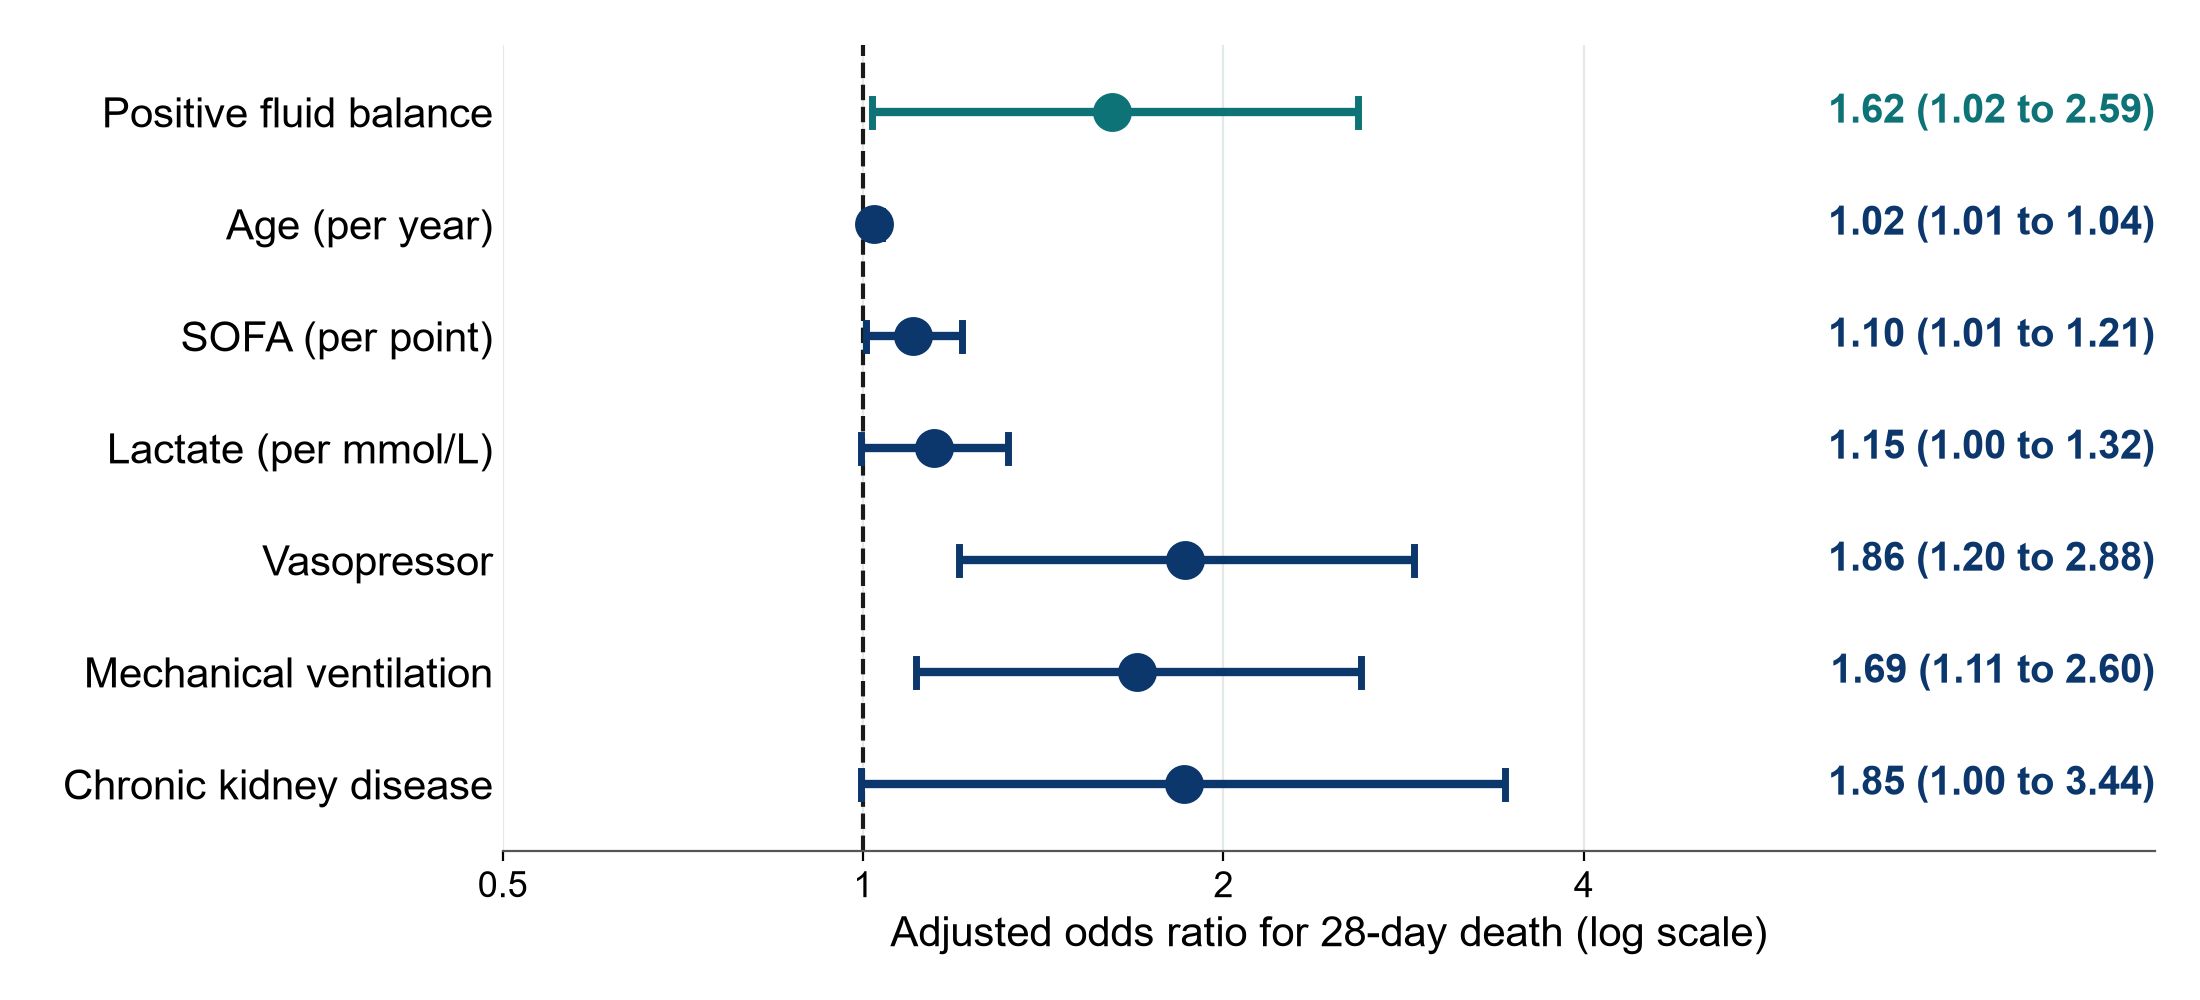
KEY MESSAGE Read each row: comparison, OR, 95% CI, does it cross 1?

Kaplan-Meier: survival to day 28 by fluid balance
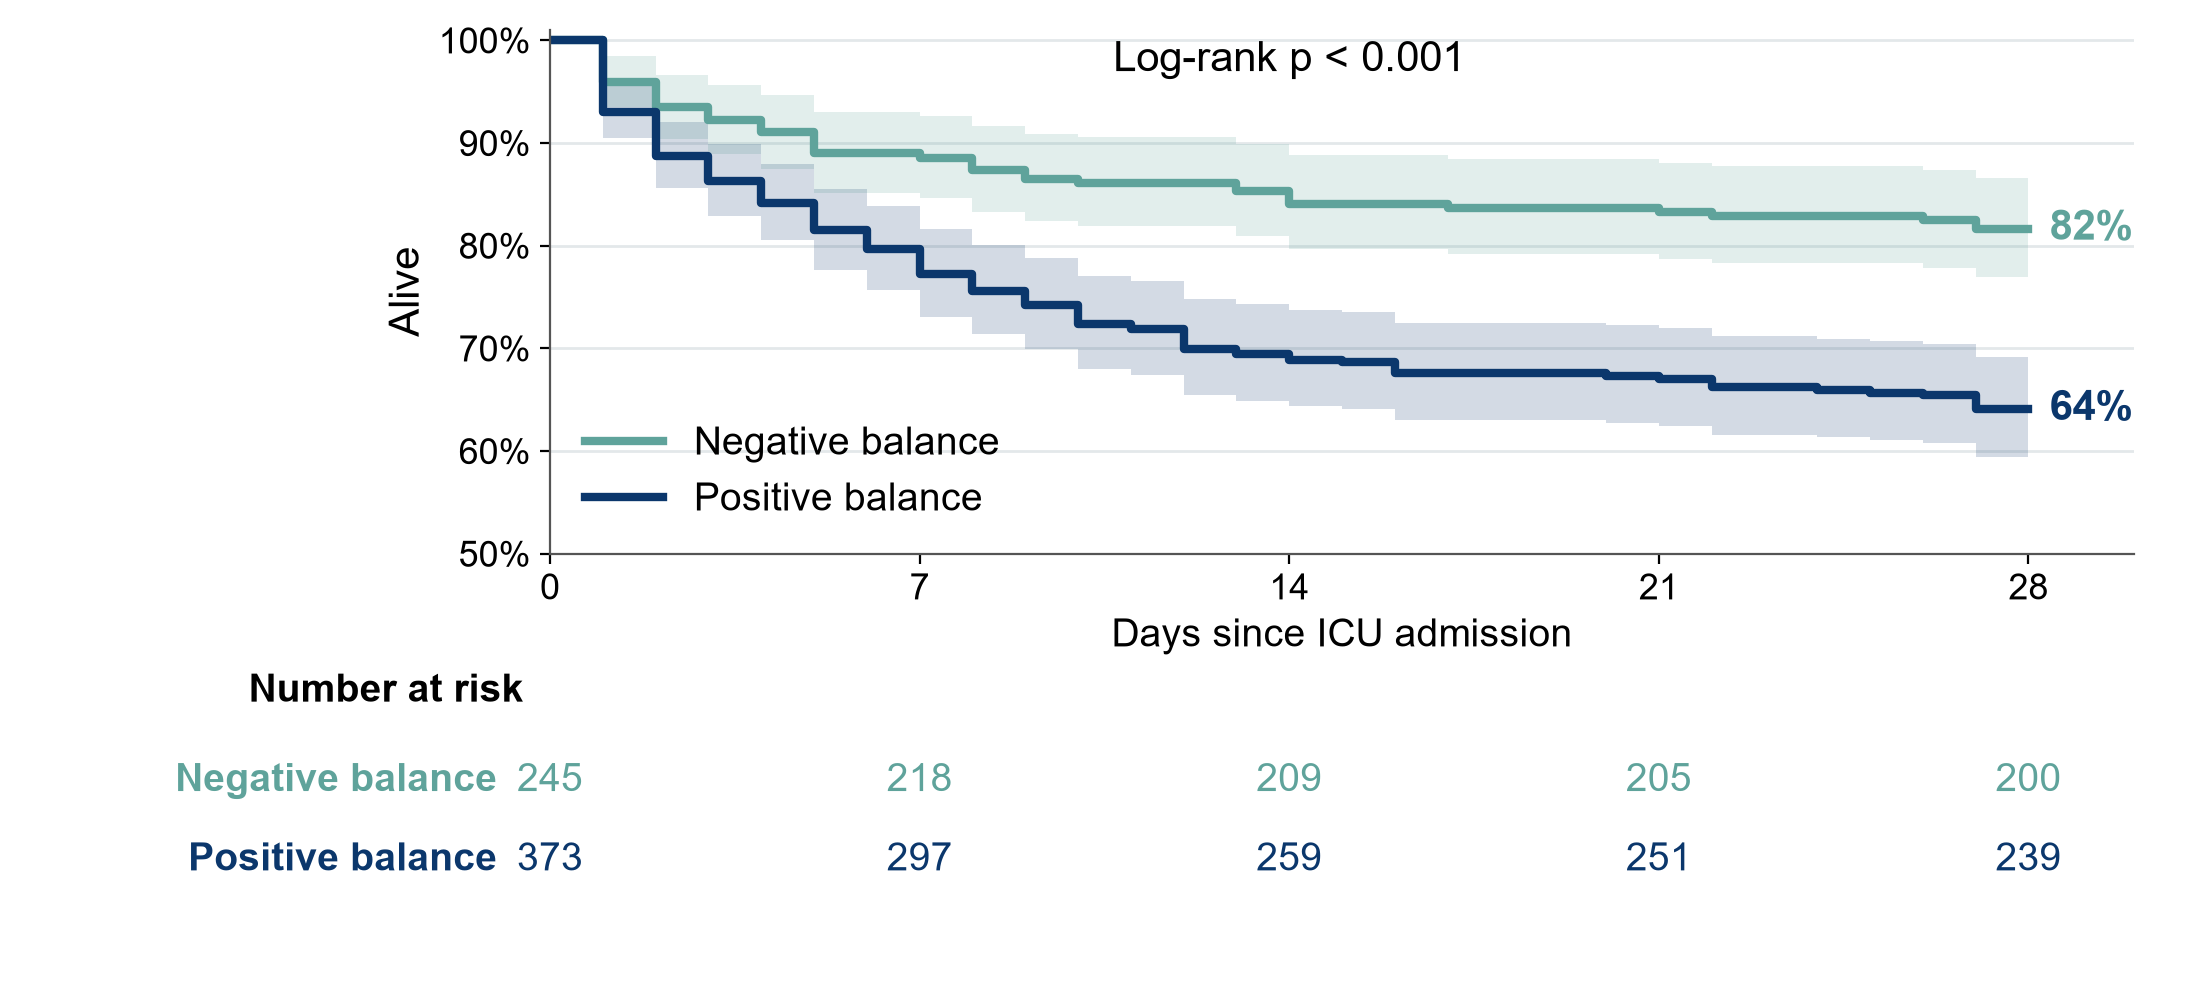
KEY MESSAGE Day-28 survival 81.6% vs 64.1%, log-rank p < 0.001: unadjusted.

Cox model: the same story in hazard ratios

Q1 supportive analysis (04_models.R). HR = hazard ratio. OR = odds ratio.

Crude HR

  • 2.17
  • 95% CI 1.55 to 3.05

Adjusted HR

  • 1.46
  • 95% CI 1.00 to 2.13
  • p = 0.053

Assumption

  • Proportional hazards: global test p = 0.10
  • Acceptable

Compare

  • Adjusted OR 1.62, p = 0.044
  • Adjusted HR 1.46, p = 0.053
  • Same direction and size

KEY MESSAGE p = 0.044 and p = 0.053 tell the same story: read the estimates and CIs.

Why is it missing? MCAR, MAR and MNAR
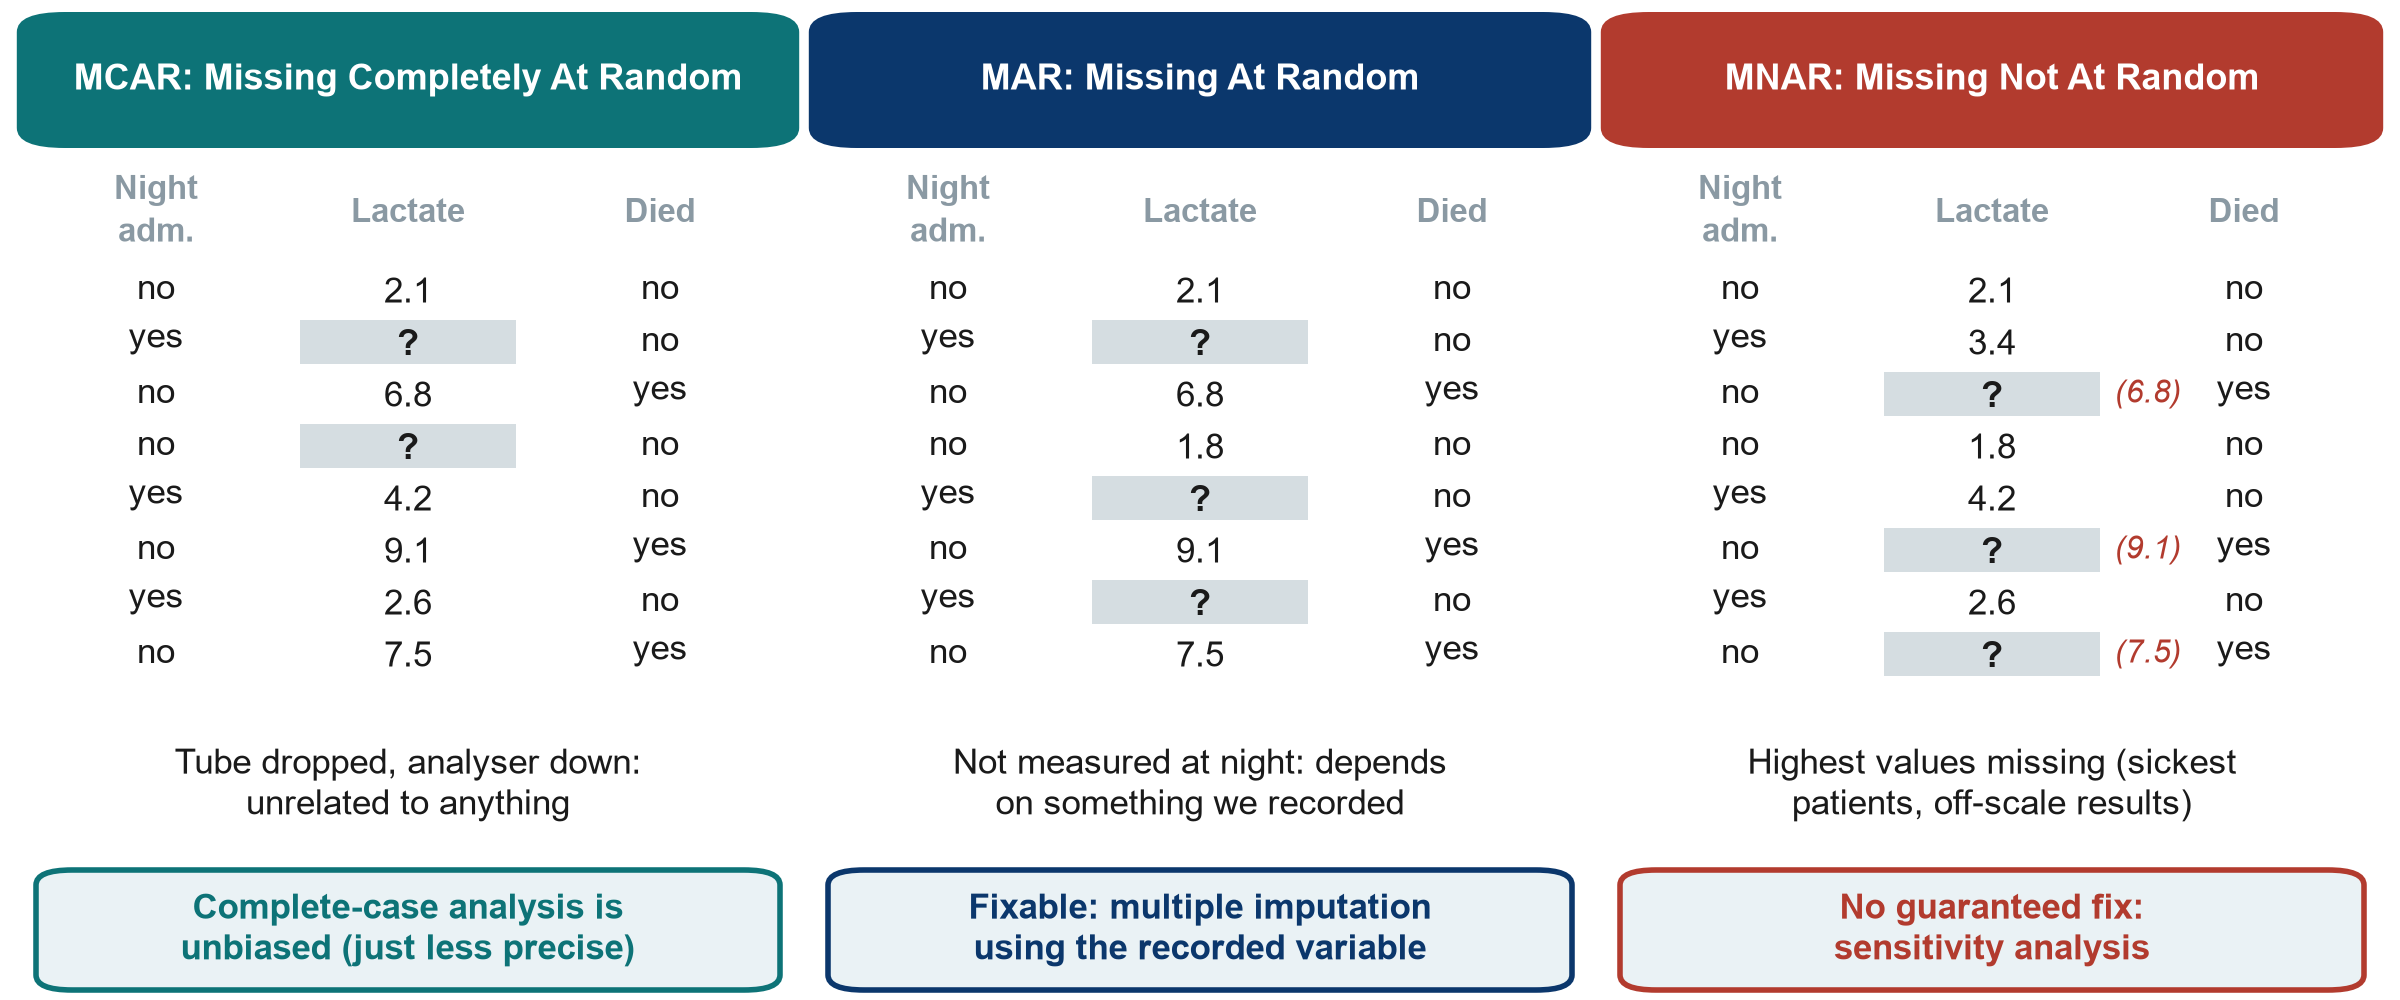
KEY MESSAGE The reason data are missing decides how dangerous the gaps are.

Who is missing lactate? Not a random 15%
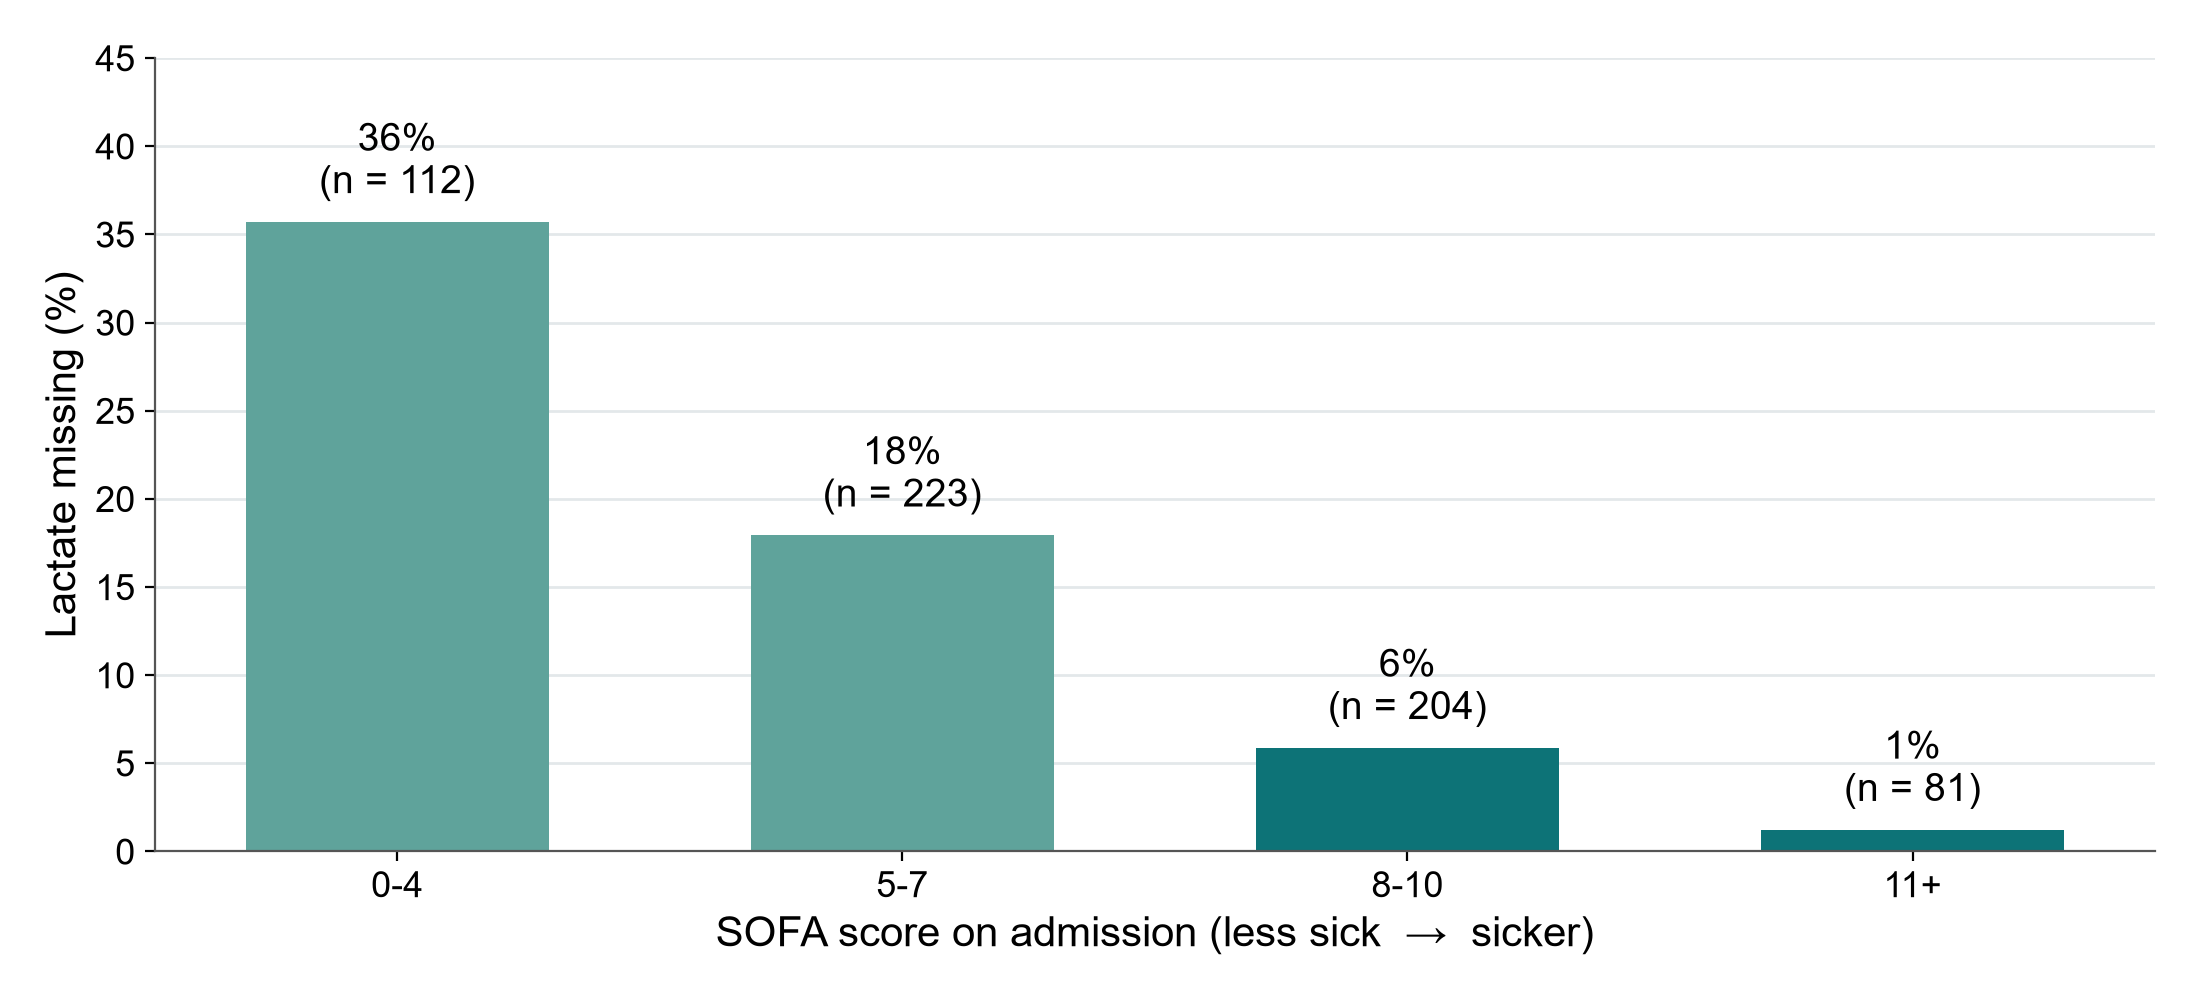
KEY MESSAGE Lactate was missing mostly in less sick patients: not MCAR, but MAR is plausible.

Complete case vs multiple imputation (Q4)
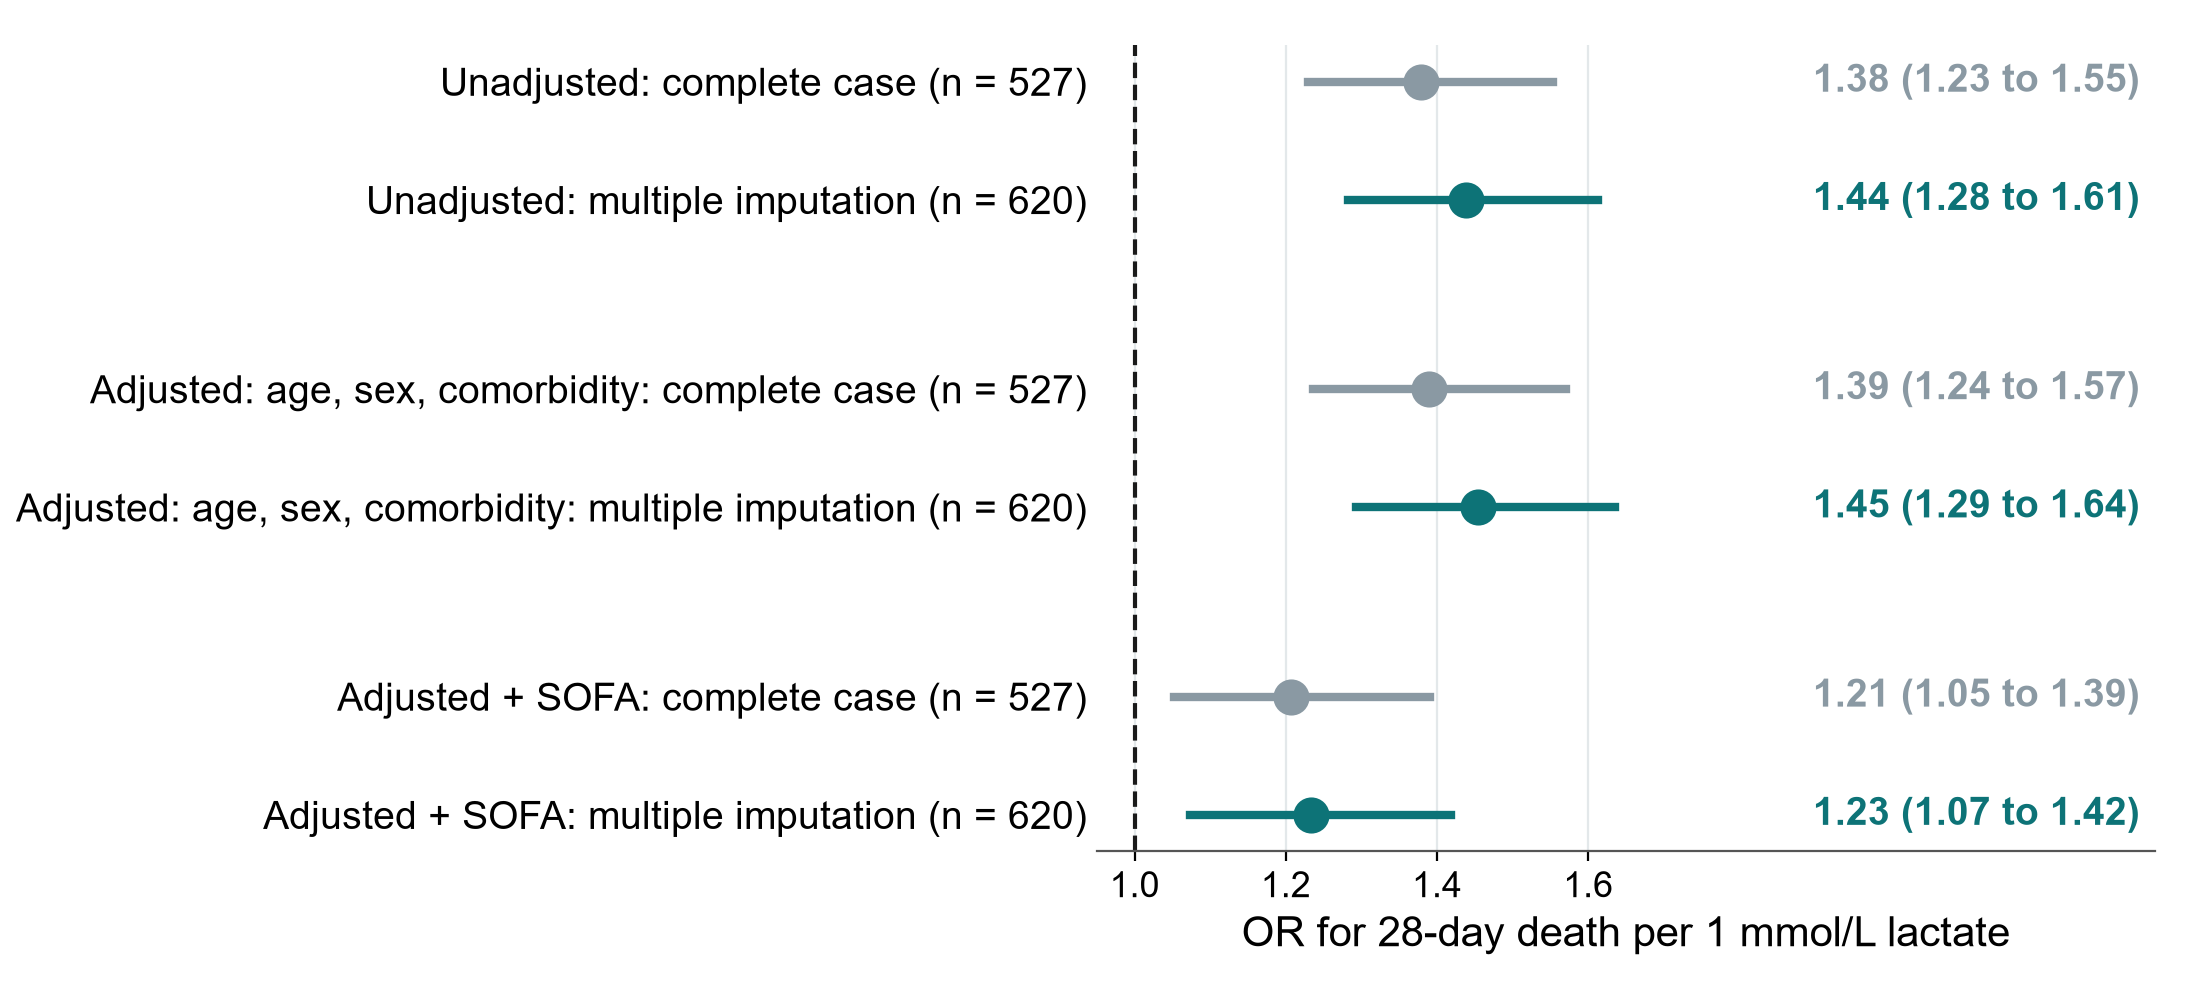
KEY MESSAGE Multiple imputation keeps all 620 patients. The answer changes only modestly.

Interpret the models together

WHOLE-CLASS TASK · 7 min

  • Q1 in full: crude and adjusted OR in the model table of the Q1 results pack (PDF)
  • Question for the class: how much did adjustment change the estimate, and why?
  • Poll: does the adjusted 95% CI include 1?
  • Together we write two Results sentences: crude, then adjusted, with CIs
  • Q2 to Q5: crude and adjusted estimates read in one line each

Words to use

  • ‘associated with’
  • ‘after adjustment for’
  • ‘95% CI’
  • not ‘caused’

OUTPUT Two Results sentences for Q1, one line each for Q2 to Q5 (Exercise 8)

Proposal builder 6: what a good one contains

Modelled on the running example (a restrictive fluids trial).

Sample size

  • Mortality 40% vs 30%
  • Power 80%, alpha 5% two-sided
  • 356 per group, plus 10%

Analysis plan

  • Describe: n (%), median (IQR)
  • Compare: chi-square
  • Report: RR with 95% CI

Confounders

  • Chosen in advance
  • About 10 events per variable

Missing data

  • Expected gaps and why
  • Prevention
  • How it will be reported

KEY MESSAGE Today: how many patients, which analysis, and what if data are missing.

Proposal builder 6: sample size and analysis plan

PROPOSAL BUILDER · 30 min

  • The instructor models each part live on the running example (18 min)
  • Sample size, analysis plan, confounders, missing-data plan
  • Then draft your own sample-size inputs in your proposal template (10 min, on your own)
  • Questions (2 min): raise your hand or use the chat. The other parts are homework

Use these tools

  • Sample-size spreadsheet
  • Test decision table (6.1)
  • FLUID-ICU SAP as a model
  • Exercise sheet: Exercise 9

OUTPUT Your own proposal, Part 3 completed: sample size started now, the rest as homework

Key words of the day

Twelve words you should now be able to explain to a colleague.

Uncertainty

  • 95% CI
  • p-value (two-sided)
  • Power

Comparing

  • t-test / Mann-Whitney
  • Chi-square
  • Paired

Models

  • Adjusted OR
  • Hazard ratio
  • Censoring

Honesty

  • SAP
  • MCAR / MAR / MNAR
  • Multiple imputation

KEY MESSAGE If one word is unclear, ask now or look it up in the glossary.

Session 6 recap

Three messages to take home.

Read the CI

  • Effect + 95% CI
  • Where is the null?
  • p is a supporting actor

Adjust honestly

  • Crude vs adjusted
  • Confounders chosen in advance

Plan first

  • SAP before the data
  • Two-sided tests
  • Missing data: report, handle, test

KEY MESSAGE A good analysis is planned before, adjusted honestly and read through its CI.

Wrap-up and homework

DISCUSSION · 5 min

  • Key words and recap (previous two slides)
  • Exit question in the chat: in one sentence, what does ‘95% CI 1.48 to 3.06’ tell you?
  • Homework: finish Part 3 of your own proposal. Start your proposal slides (everyone submits them)
  • Re-read the results pack of the question you chose: it becomes your Methods and Results in Session 7

Weeks 7-8

  • Protocol, ethics, registration
  • Research integrity
  • Writing Methods and Results
  • Getting published
  • Volunteer presentations

OUTPUT Exit answer in the chat (or a one-question form). Part 3 complete

Extra slides: Session 6

Extra slides: use if time allows, or for self-study.

Interaction, null values, prediction and machine learning, missing-data details

Extra: the pre-specified interaction with heart failure (Q1)
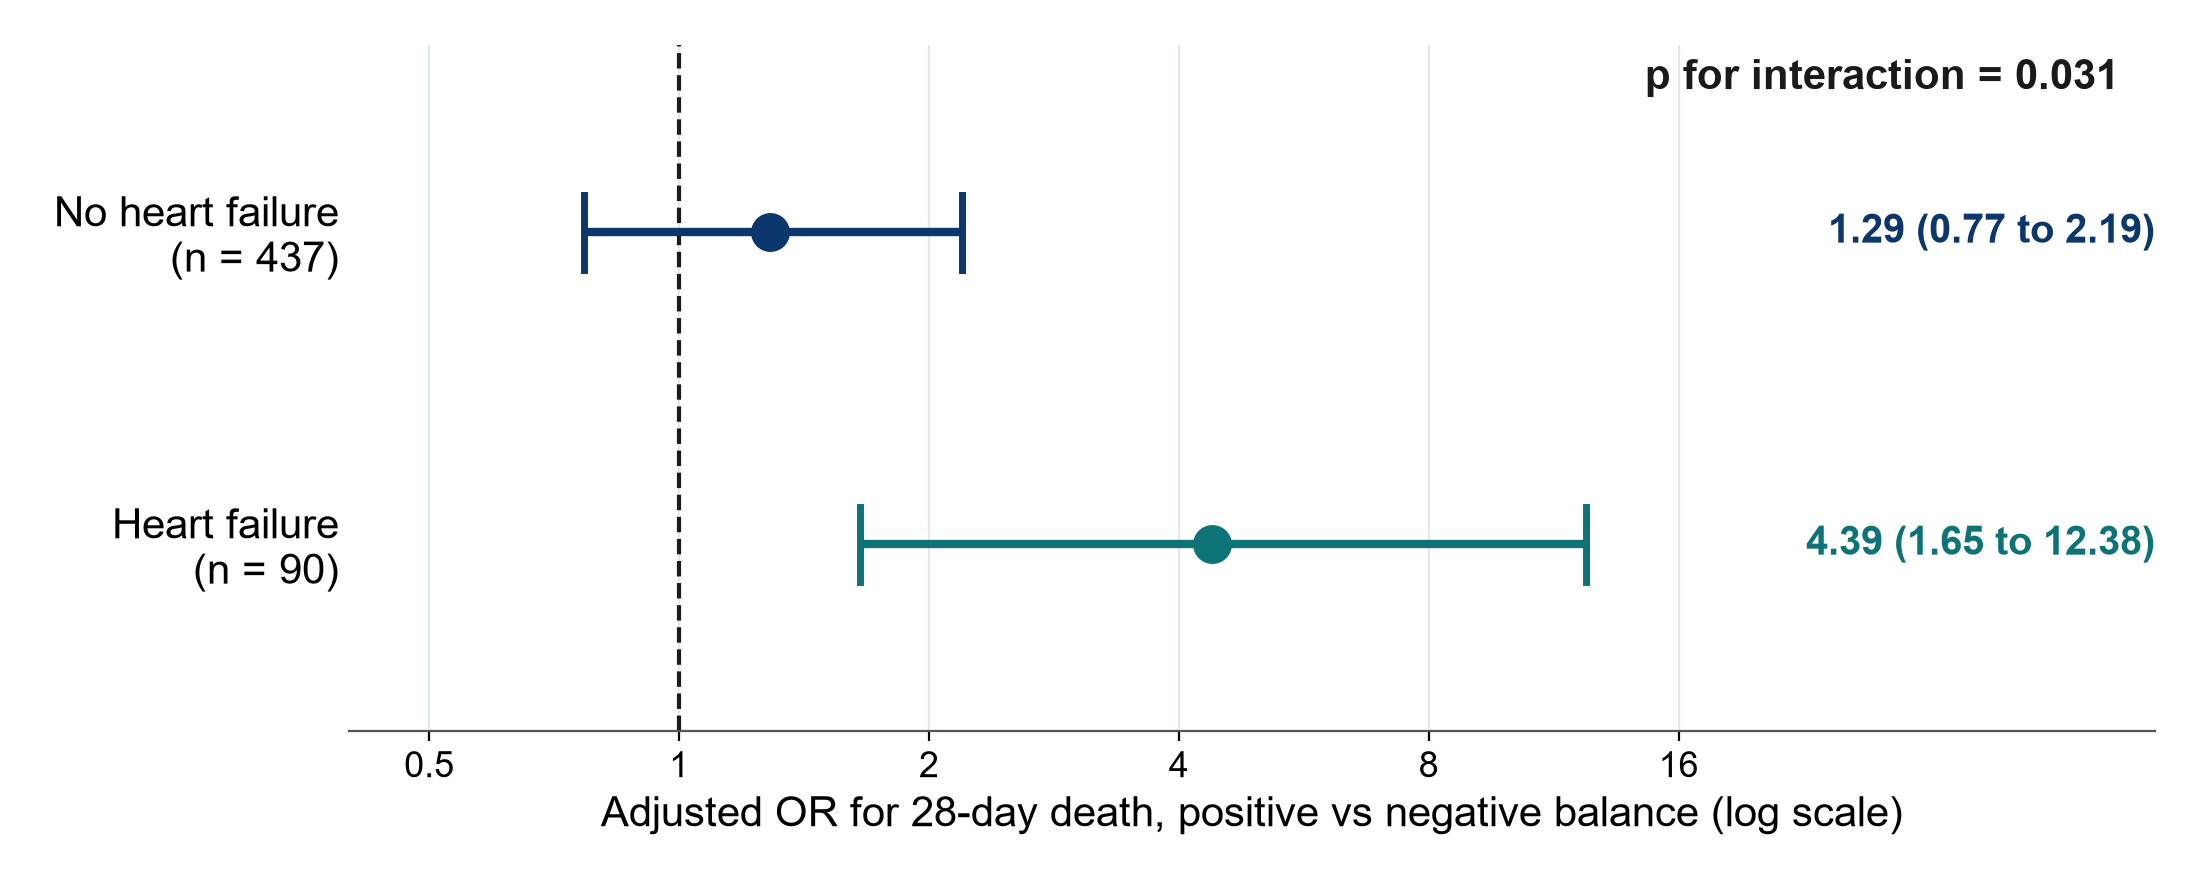
KEY MESSAGE Stronger association in heart failure (p for interaction 0.031): needs confirmation.

Extra: AKI rises with fluid balance (Q2)
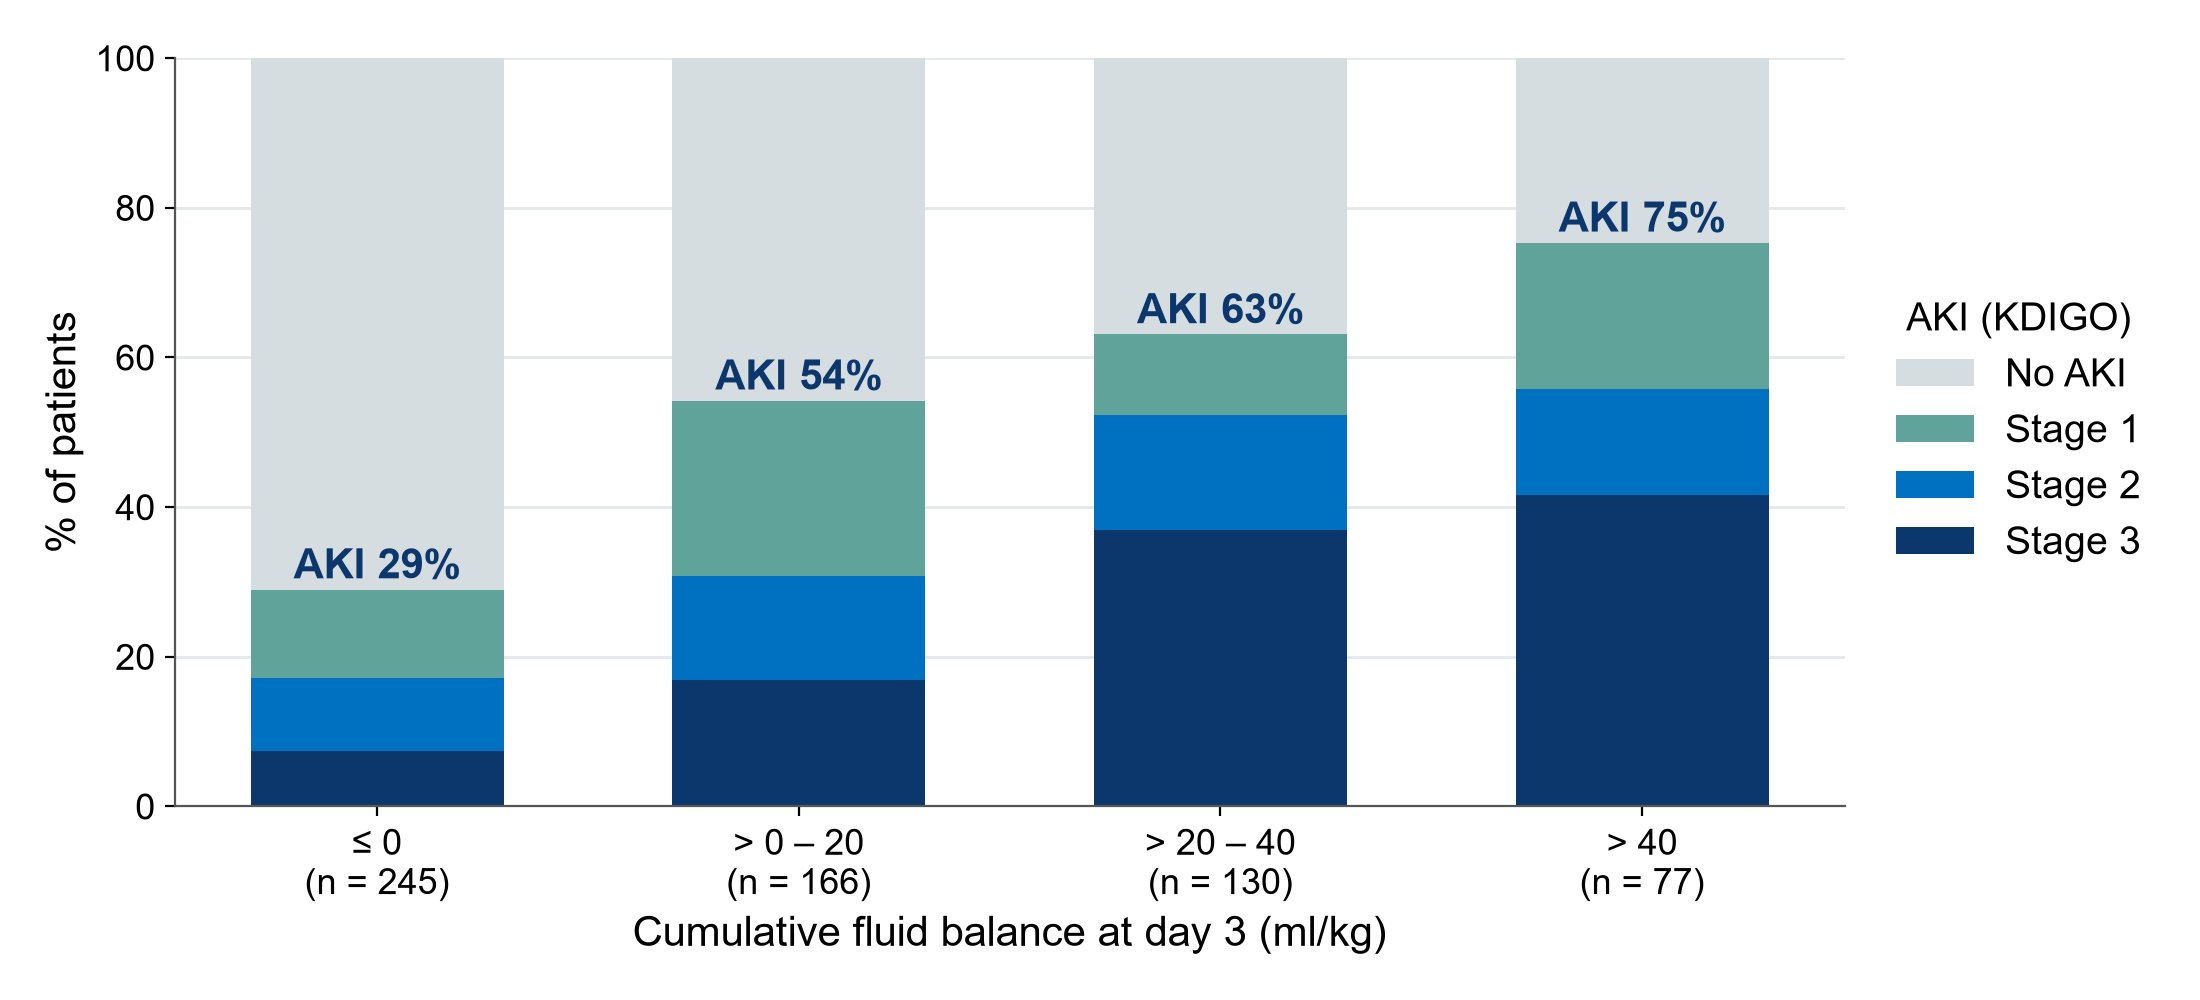
KEY MESSAGE A dose-response gradient: 29%, 54%, 63%, 75% AKI across balance groups.

Extra: ventilator-free days, a tricky outcome (Q3)
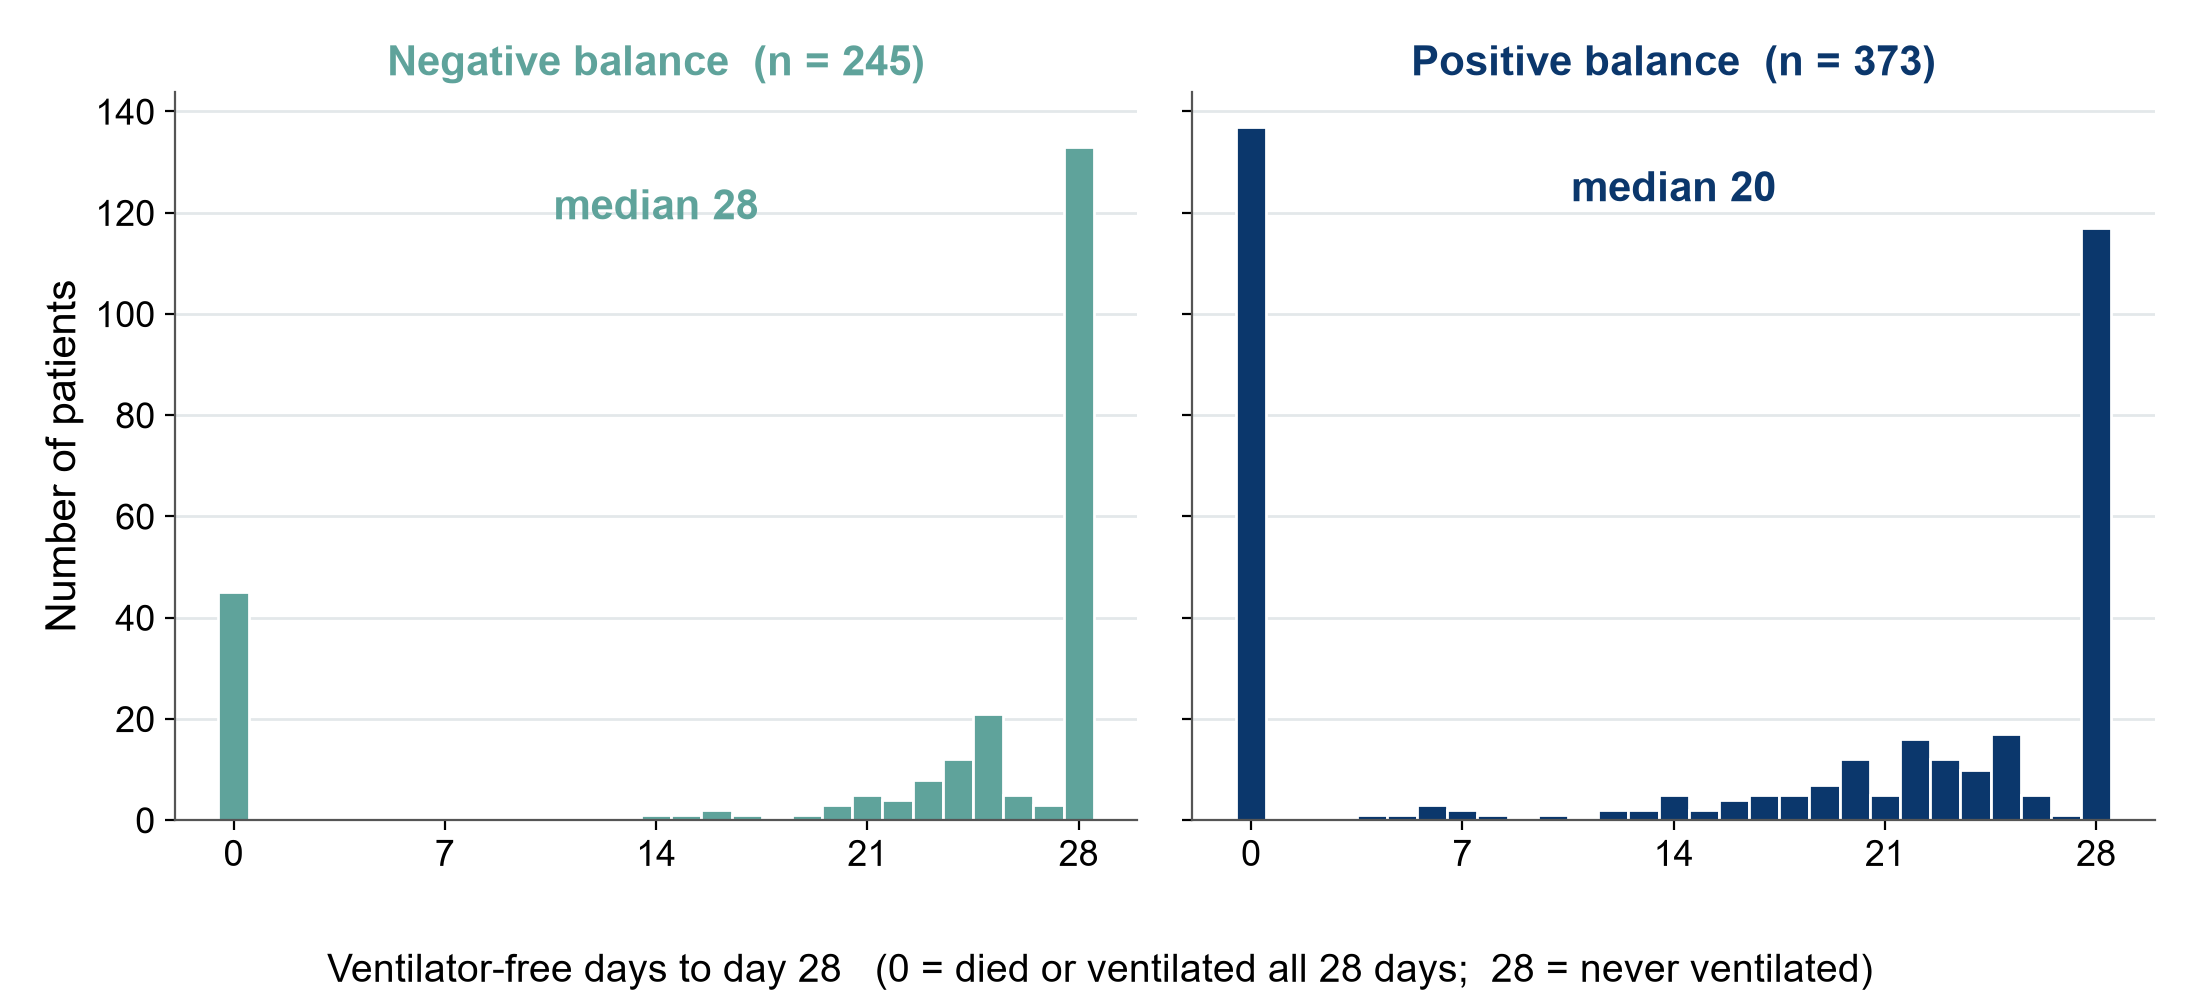
KEY MESSAGE Piled up at 0 and 28: report medians and use non-parametric tests.

Extra: Sample and population
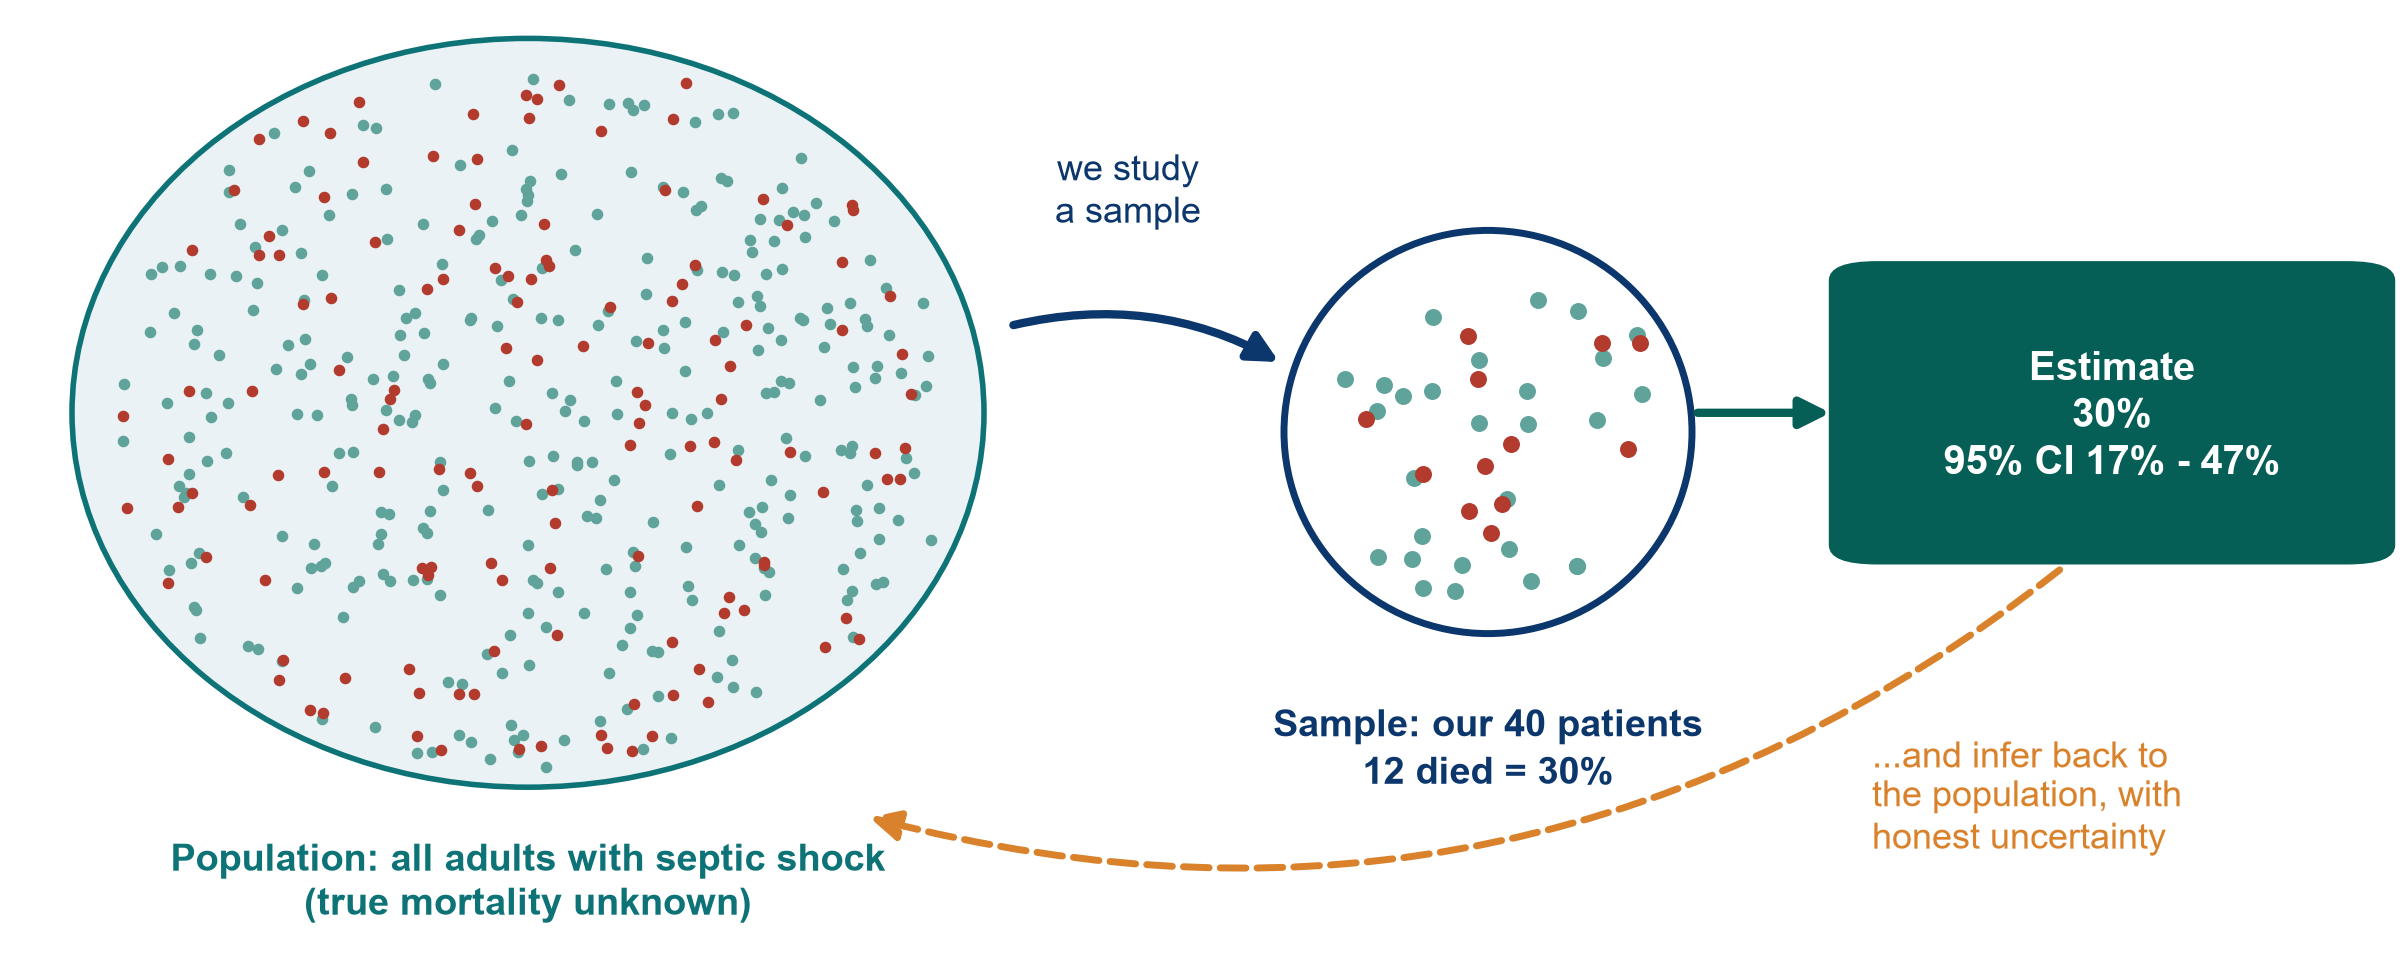
KEY MESSAGE A sample gives an estimate. The CI says how precise it is.

Extra: Reading a 95% CI in a real paper

Paper 1 (Boulet 2024, pilot RCT, Course/Papers), primary outcome: cumulative fluid balance at day 5.

The result

  • Median 6.9 vs 35.0 ml/kg
  • Mean difference 13.2 ml/kg
  • 95% CI -15.2 to 41.6
  • p = 0.42

Where is 0?

  • 0 = no difference
  • The CI includes 0
  • So ‘no difference’ is compatible with the data

How wide?

  • From 15 ml/kg in one direction to 42 ml/kg in the other
  • Very imprecise: only 48 patients

KEY MESSAGE ‘Not significant’ with a wide CI means ‘we do not know’, not ‘no effect’.

Extra: the running example in one forest plot
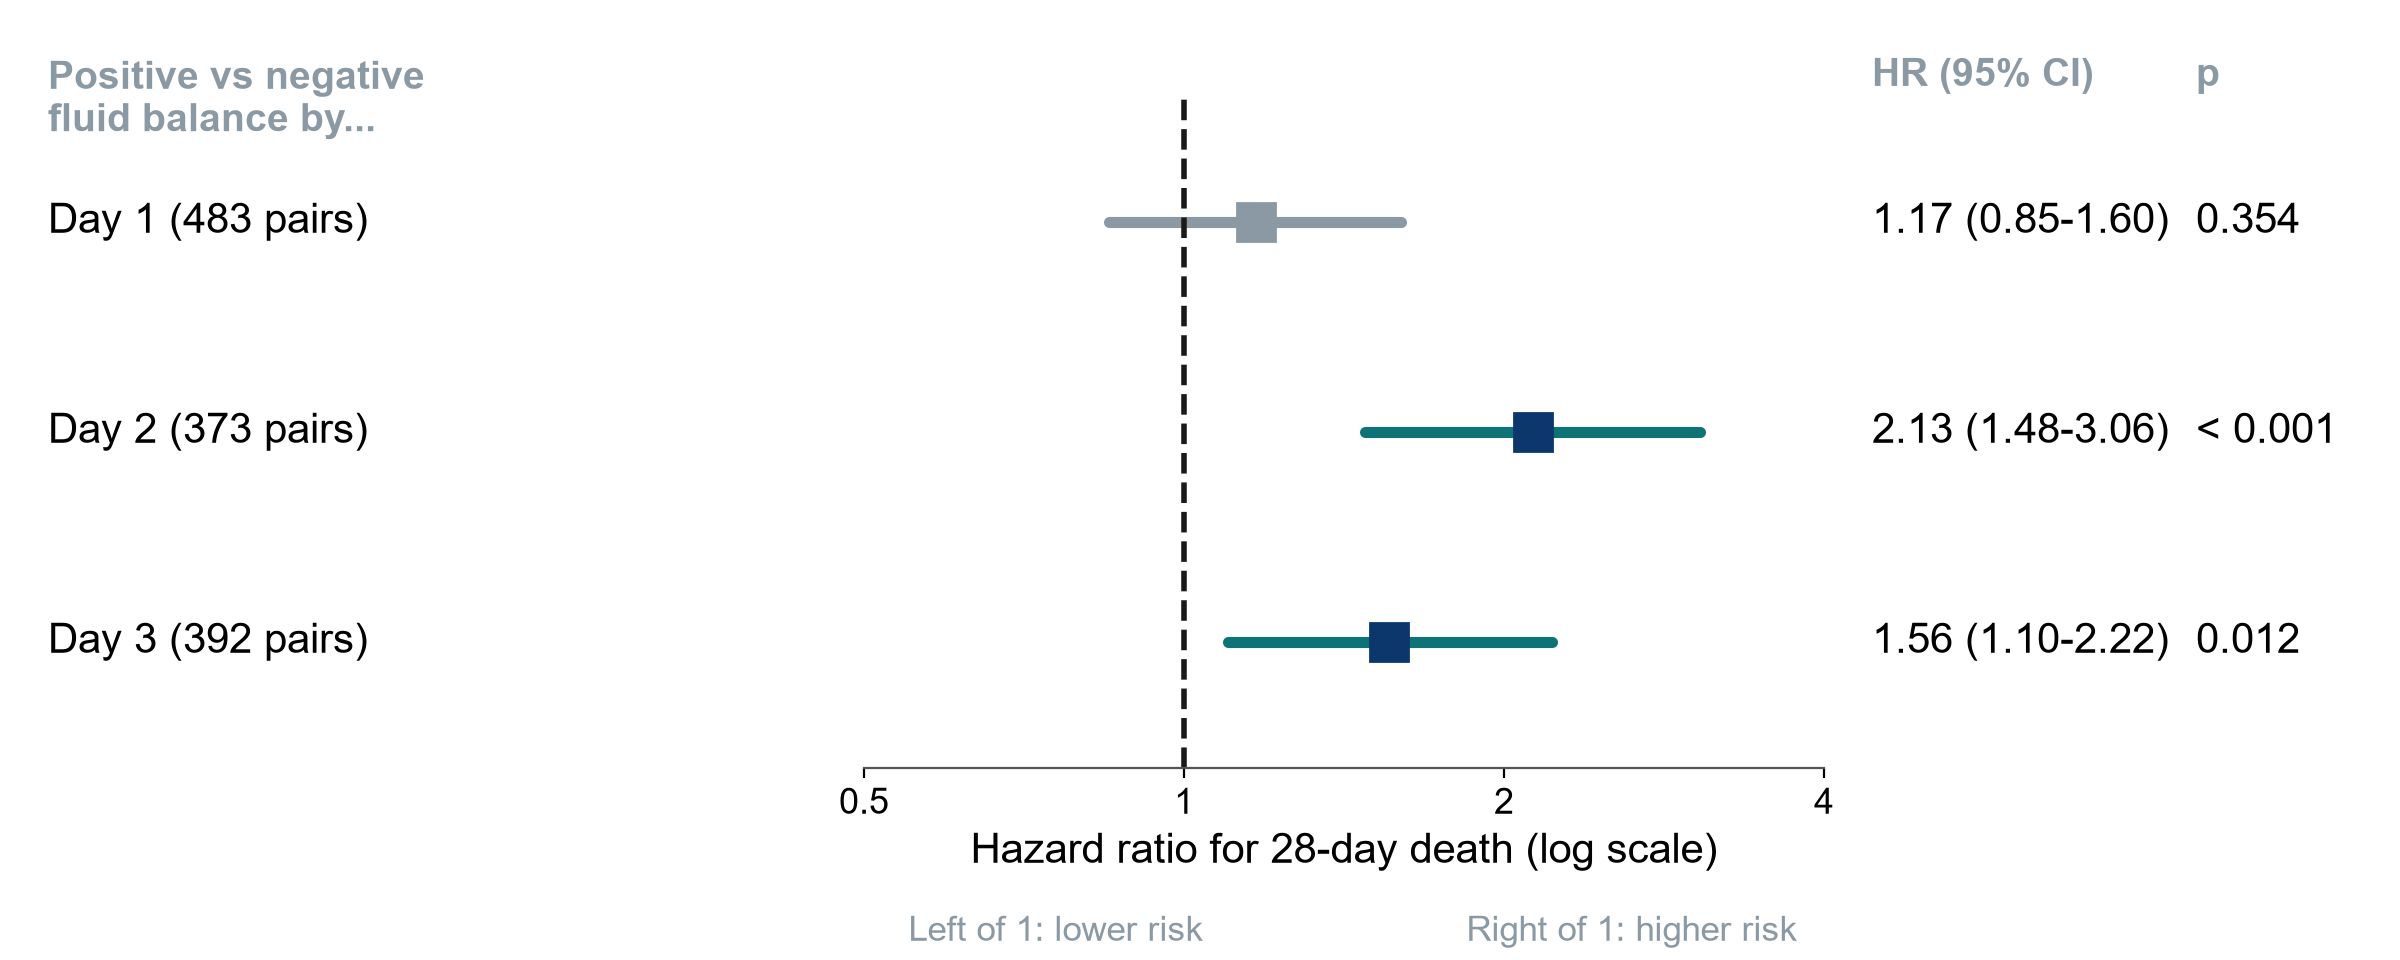
Paper 2 (Hyun 2023): positive vs negative cumulative fluid balance, propensity-matched cohorts

KEY MESSAGE Day 1: CI crosses 1. Days 2 and 3: CIs above 1, so higher risk.

Extra: Log-rank, Cox and proportional hazards

Three terms you will meet in every survival paper. KM = Kaplan-Meier. HR = hazard ratio.

Log-rank test

  • Compares whole KM curves
  • Gives a p-value
  • No effect size, no adjustment

Cox regression

  • Gives an HR with its 95% CI
  • No effect = 1
  • Can adjust for confounders

Proportional hazards

  • Assumes the HR is constant over time
  • Crossing curves: be careful

KEY MESSAGE Paper 2 (Hyun 2023): Cox HR 2.13 (1.48-3.06), about double the hazard of death.

Extra: Correlation is not agreement, and not causation
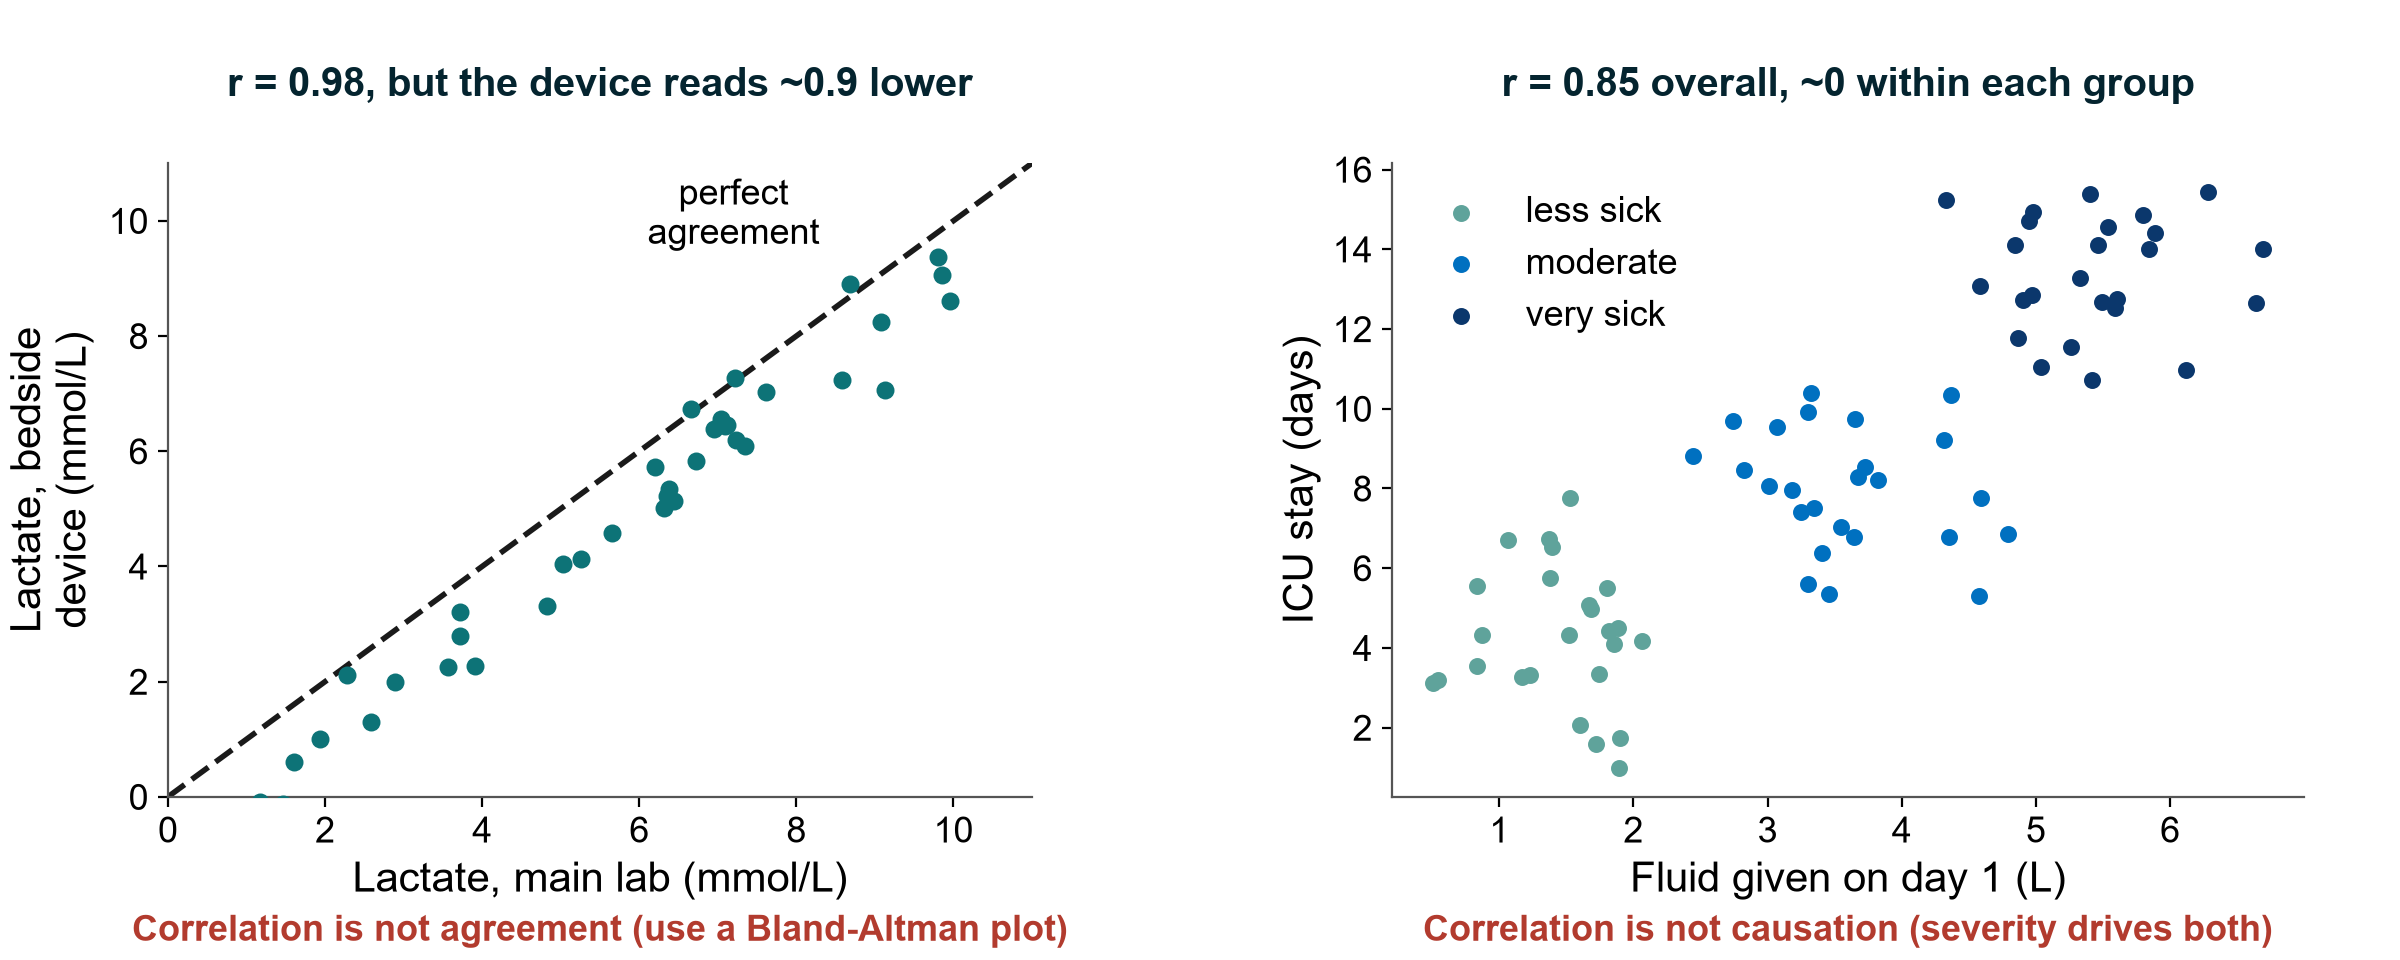
KEY MESSAGE High r does not mean two methods agree, nor that one causes the other.

Extra: Interaction in a model: does the effect differ between groups?
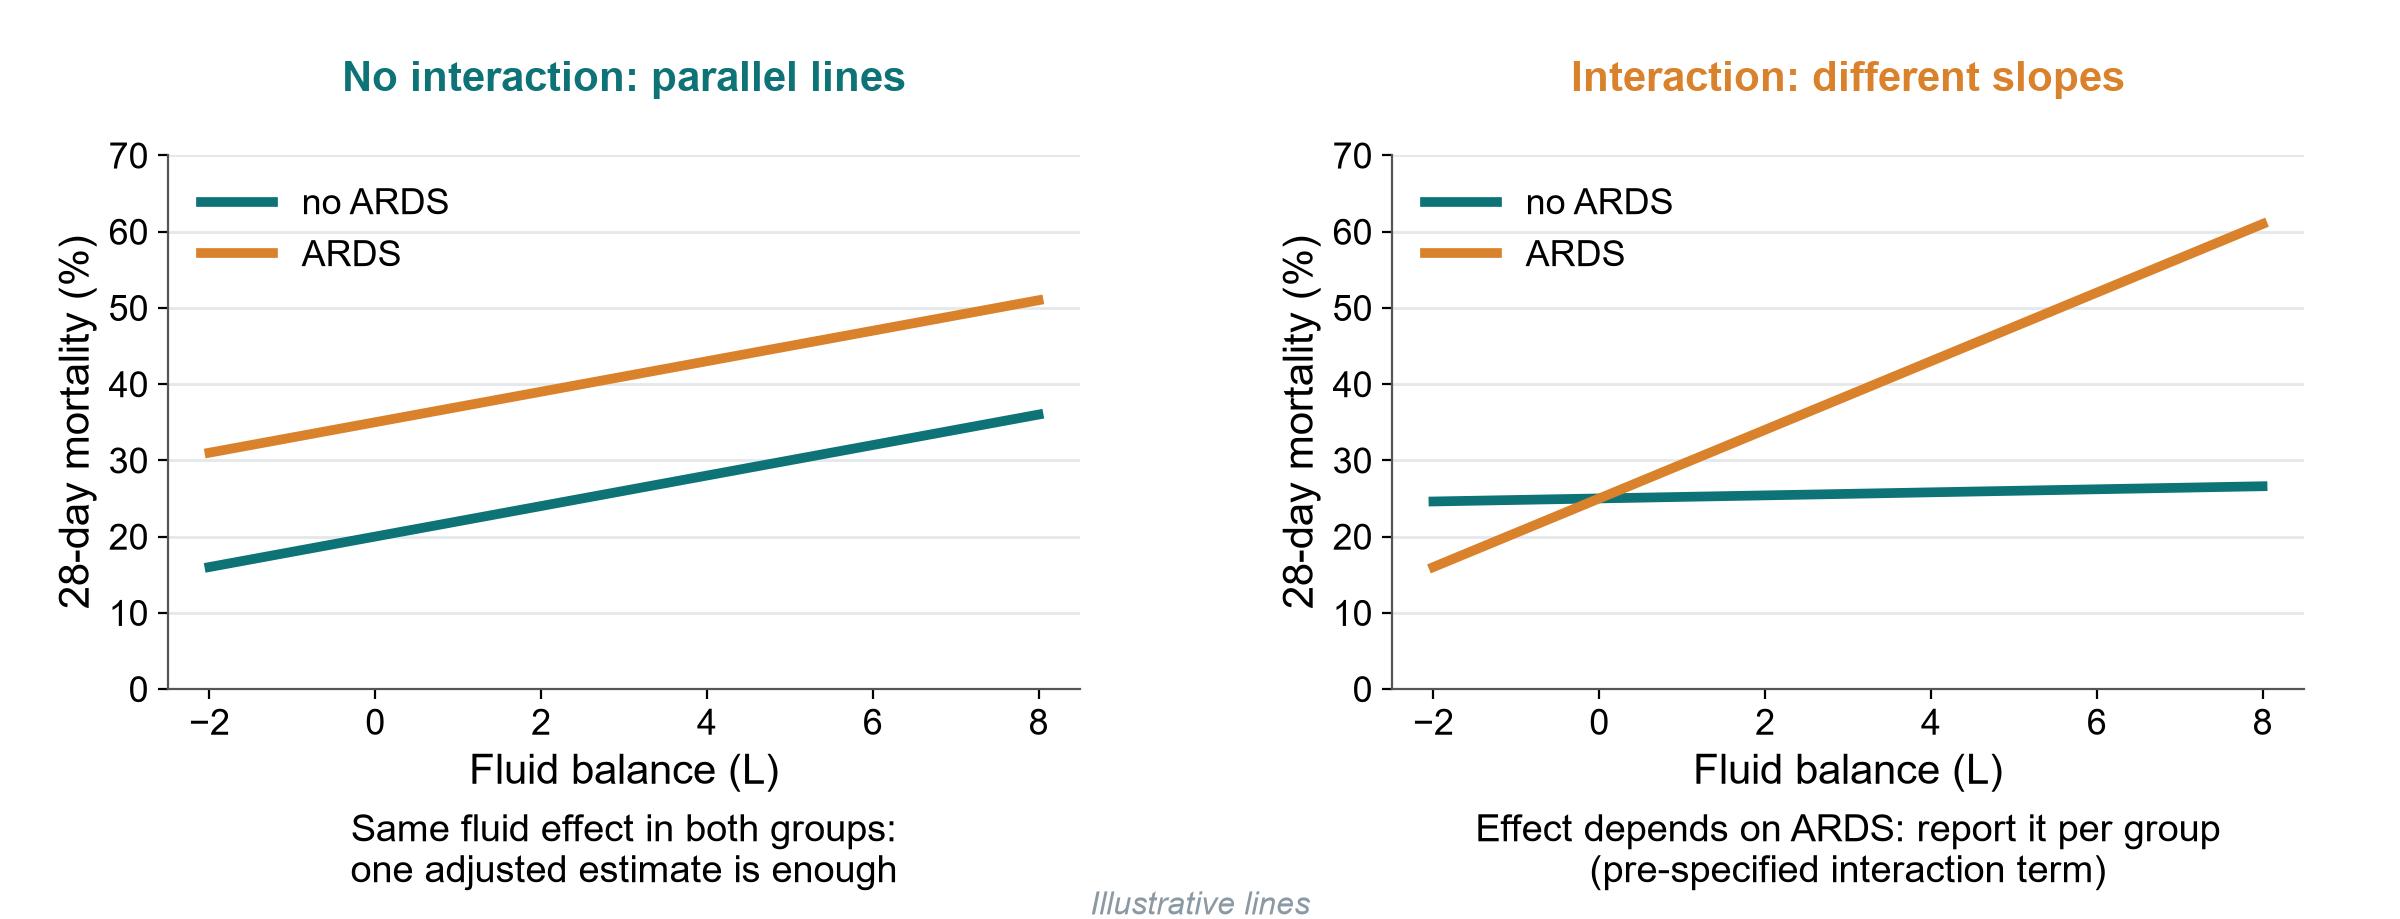
KEY MESSAGE Parallel lines: adjust. Different slopes: report the effect for each group.

Extra: The ‘no effect’ line: 0 for differences, 1 for ratios
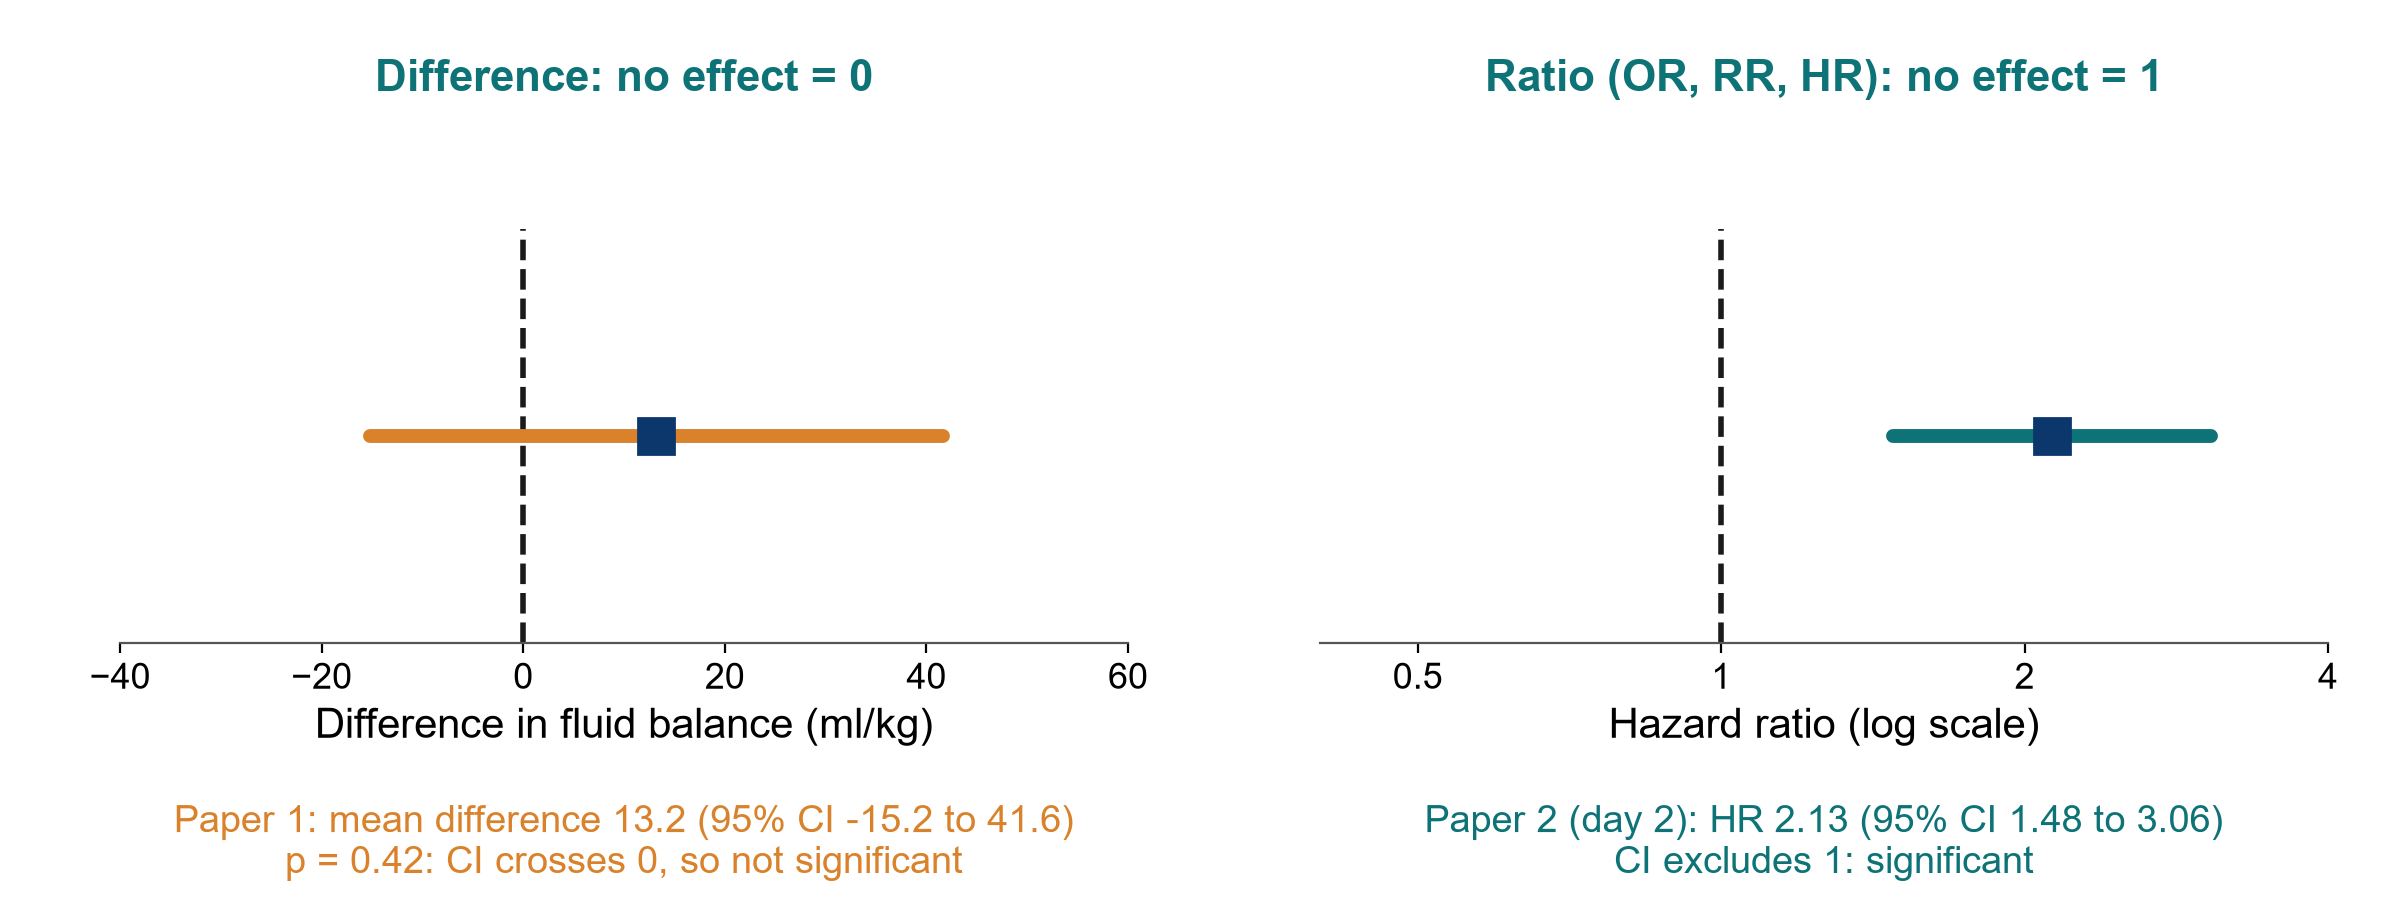
KEY MESSAGE Find the null value first, then see if the CI crosses it.

Extra: Prediction models: discrimination and calibration
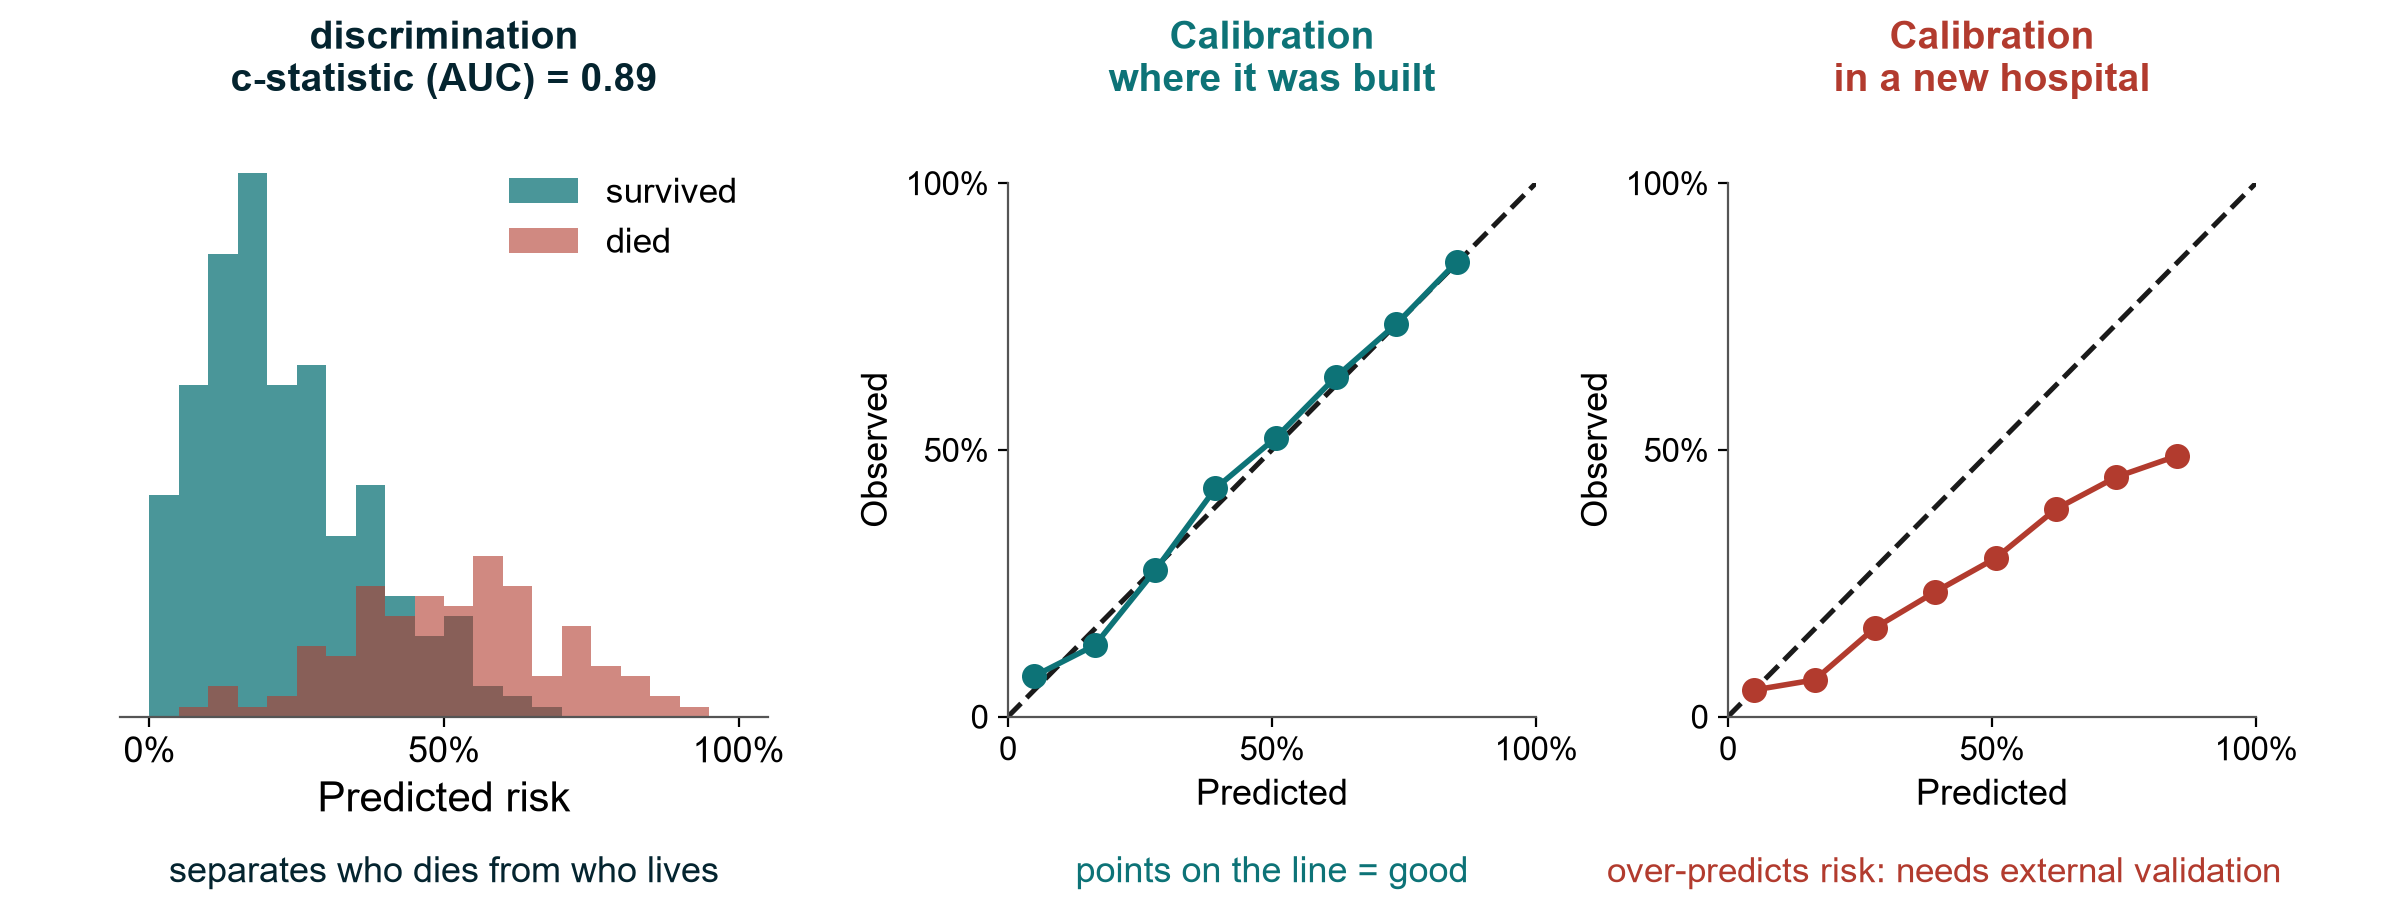
KEY MESSAGE A good prediction model separates patients and gets the risks right, in new hospitals too.

Extra: Prediction and machine learning: how to judge a model

Machine learning (ML) is a flexible way to build prediction models. The same questions apply.

What is it for?

  • Predict an individual’s risk
  • Not to explain causes
  • Who, when, which decision?

Enough data?

  • ML needs many events
  • Overfitting risk is high
  • Internal validation done?

Does it work?

  • Discrimination (AUC)
  • Calibration plot
  • External validation

Is it reported?

  • TRIPOD+AI checklist
  • Code, data, fairness
  • Impact on patients?

KEY MESSAGE An AI score is a prediction model: ask for calibration and external validation.

Extra: Complete-case analysis vs multiple imputation
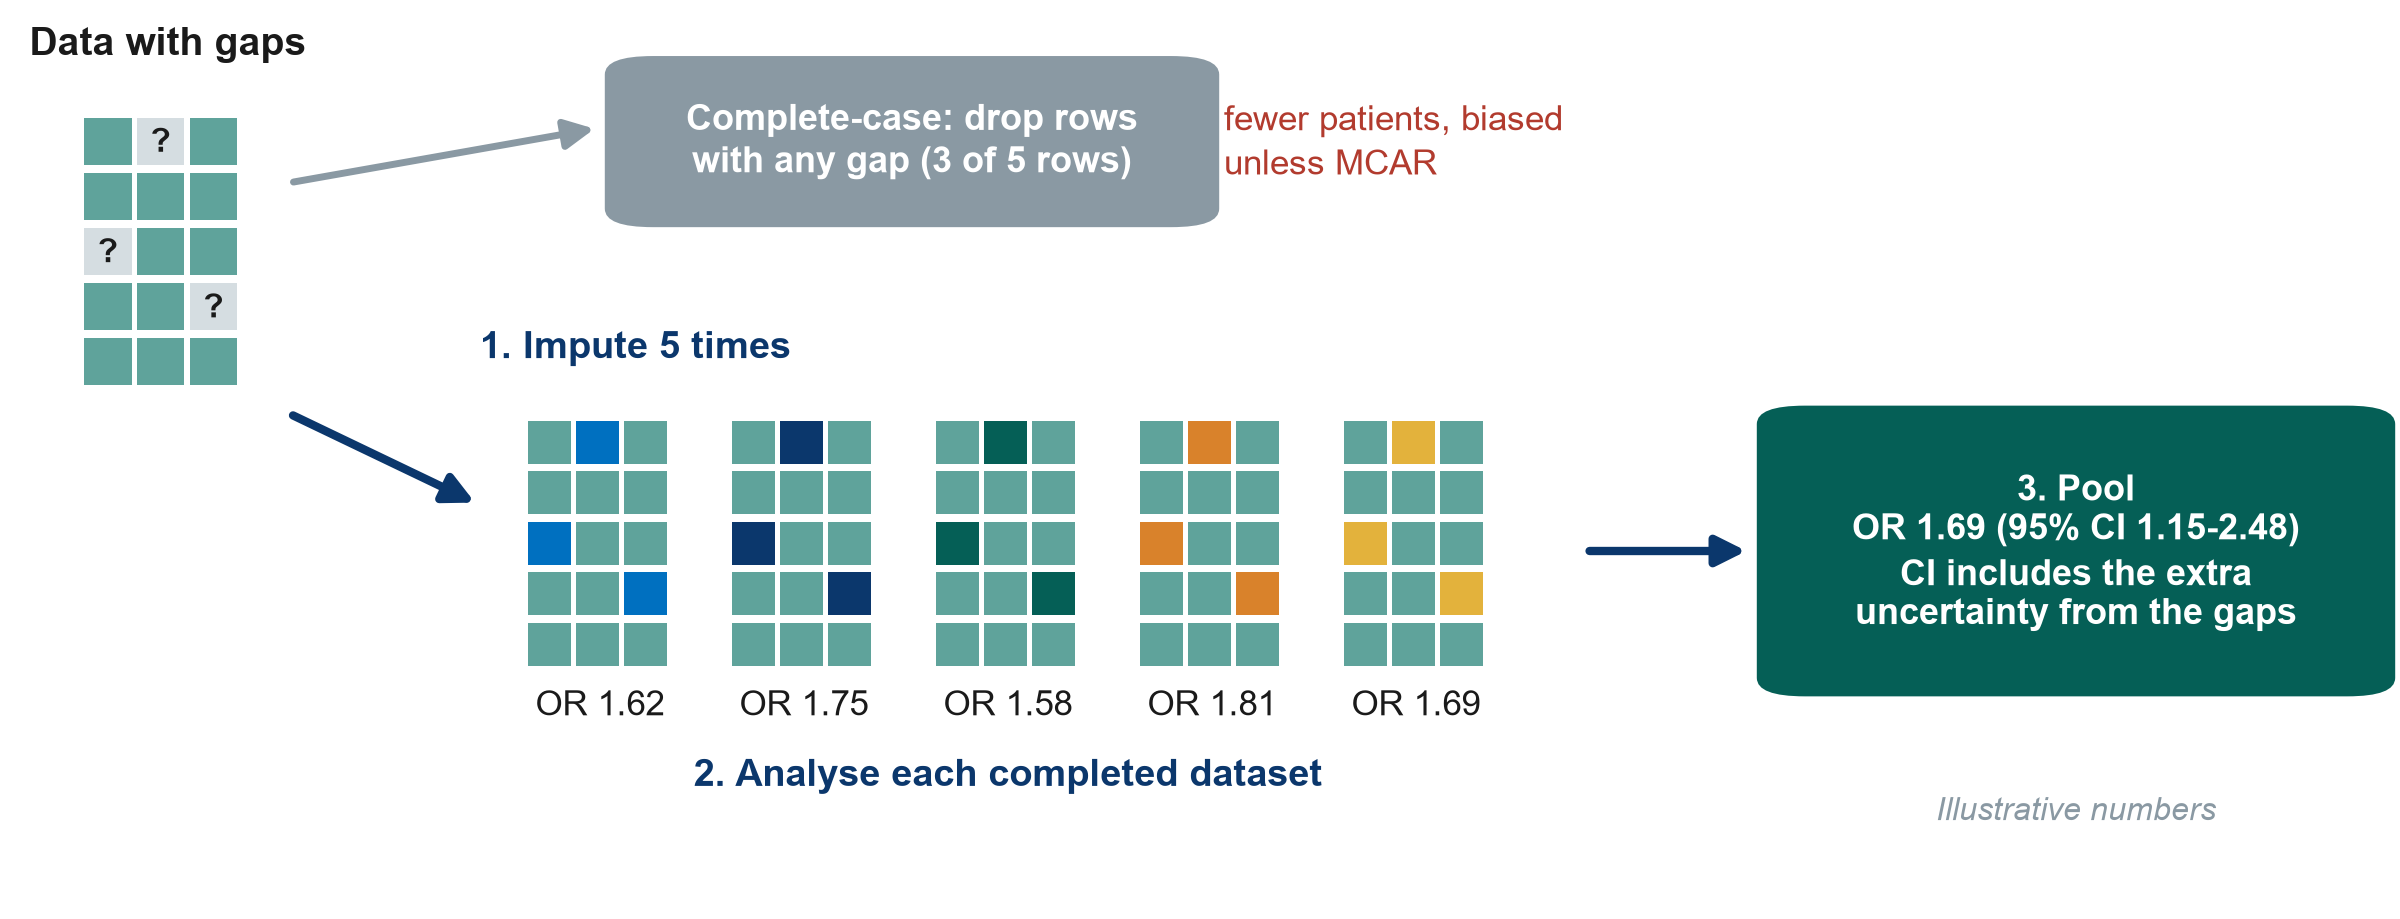
KEY MESSAGE Multiple imputation keeps every patient and admits the uncertainty of the gaps.

Extra: Report and test your missing data

Four things a reviewer will look for. MI = multiple imputation.

Report

  • n missing per variable
  • Flow diagram: who and why
  • In Table 1 or a footnote

Compare

  • Patients with vs without complete data
  • Are they different?

Sensitivity (Level 3)

  • Complete case vs MI
  • Example script: 05_missing.R
  • Done hands-on in Level 3, Module H

Plan

  • Write it in the SAP before you see the data
  • Part 3 of your proposal

KEY MESSAGE Missing data are a result: report them, handle them, test the answer.