Session 5 · Data: collect it well, describe it honestly

Foundations of Clinical Research: From Clinical Question to Publication

Vương Mỹ Lượng & Bernard Osang’ir

Neudata Consulting Ltd

Session 5 · Data: collect it well, describe it honestly

Part 1

Week 5 · Saturday

  • Recap quiz on Sessions 3-4 (10 min)
  • 5.1 Good data by design: variables, CRF, data dictionary, checks, data management
  • 5.2 Meet the course dataset FLUID-ICU (live R cleaning demo)
  • 5.3 Describing and showing data: summaries, figures, tables
  • 5.4 Describe the course dataset: Table 1 and figures
  • Proposal builder 5: variables, mini-CRF, data dictionary, data management

Recap quiz: Sessions 3-4 in three questions

QUICK QUIZ · 10 min

  • Q1. Patients who smoke are followed for 10 years to see who develops a stroke. Which design?
  • Q2. In a cohort, sicker septic patients receive more fluid and die more often. What is this called?
  • Q3. Mortality is 30% with usual care and 20% with a new strategy. What are the risk ratio (RR) and the number needed to treat (NNT)?
  • Answer each question in the poll (1 minute each), then we discuss

Answers (reveal after)

  • Q1: prospective cohort
  • Q2: confounding by indication
  • Q3: RR = 20/30 = 0.67. Risk difference (RD) = 10%. NNT = 1/0.10 = 10

OUTPUT Everyone back on track with designs, confounding and the 2x2 measures

5.1 Good data by design

Bad data cannot be rescued by good statistics.

5.1 Good data by design | 35 minutes

What type of variable is it?

Numbers are measured (first two cards). Categories are groups (last three). Time-to-event combines how long and whether it happened.

Continuous

  • Any value on a scale
  • Fluid balance (ml/kg), lactate, age

Count

  • A whole number
  • Number of organ failures

Binary

  • Two options
  • Died by day 28: yes or no

Nominal

  • Groups with no order
  • Source of sepsis: lung, urine, abdomen

Ordinal

  • Groups in an order
  • Acute kidney injury (AKI) stage 1, 2 or 3

KEY MESSAGE The variable type decides the CRF box, the summary and the test.

Check your understanding: what type of variable?

QUICK QUIZ · 3 min

  • Heart rate (beats per minute)
  • Glasgow Coma Scale (GCS, 3-15)
  • Blood group (A, B, AB, O)
  • Ventilated on day 1 (yes / no)
  • Time from ICU admission to extubation

Answers

  • Continuous
  • Ordinal (often analysed as a number)
  • Nominal
  • Binary
  • Time-to-event (some never extubated)

OUTPUT Everyone can name the variable types

Good vs bad CRF items

A case report form (CRF) question must have only one possible reading.
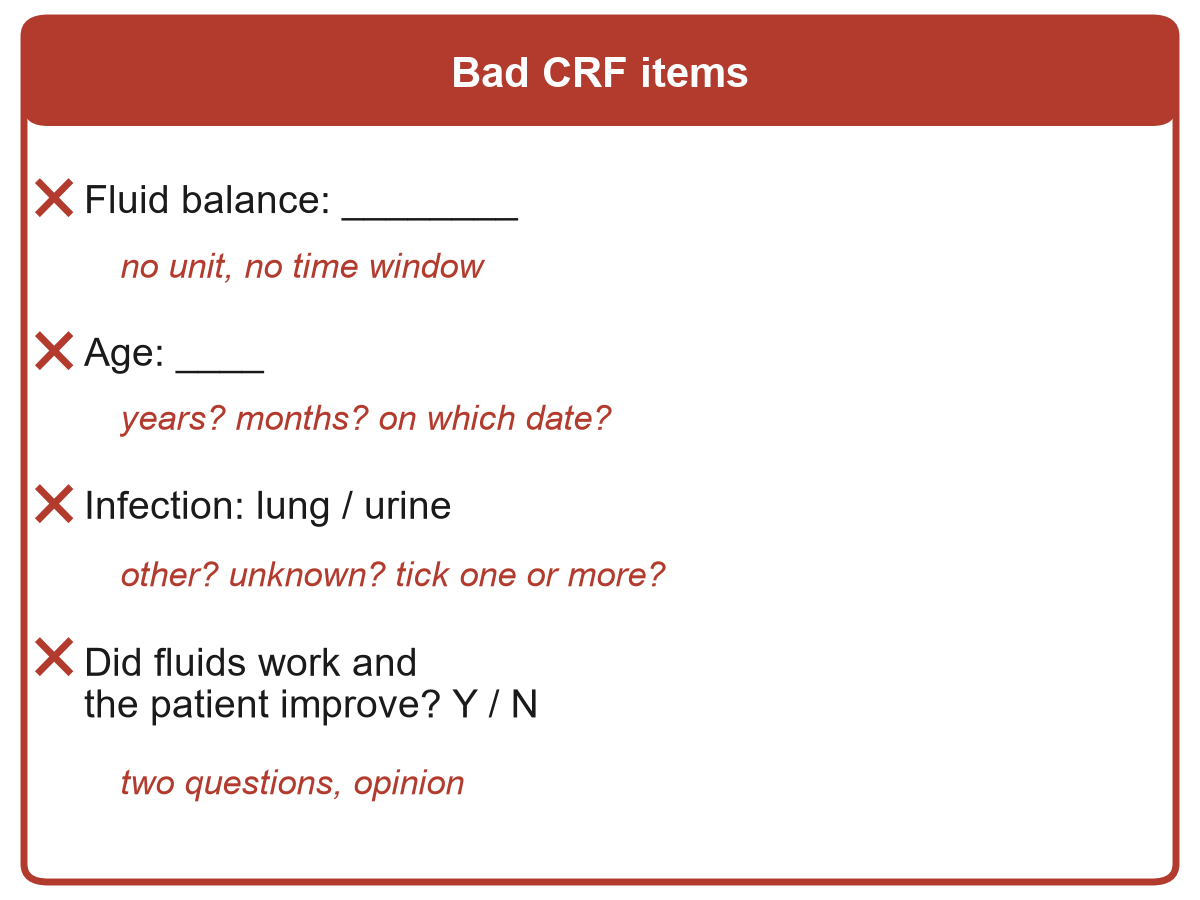
Ambiguous: two nurses will write two different things
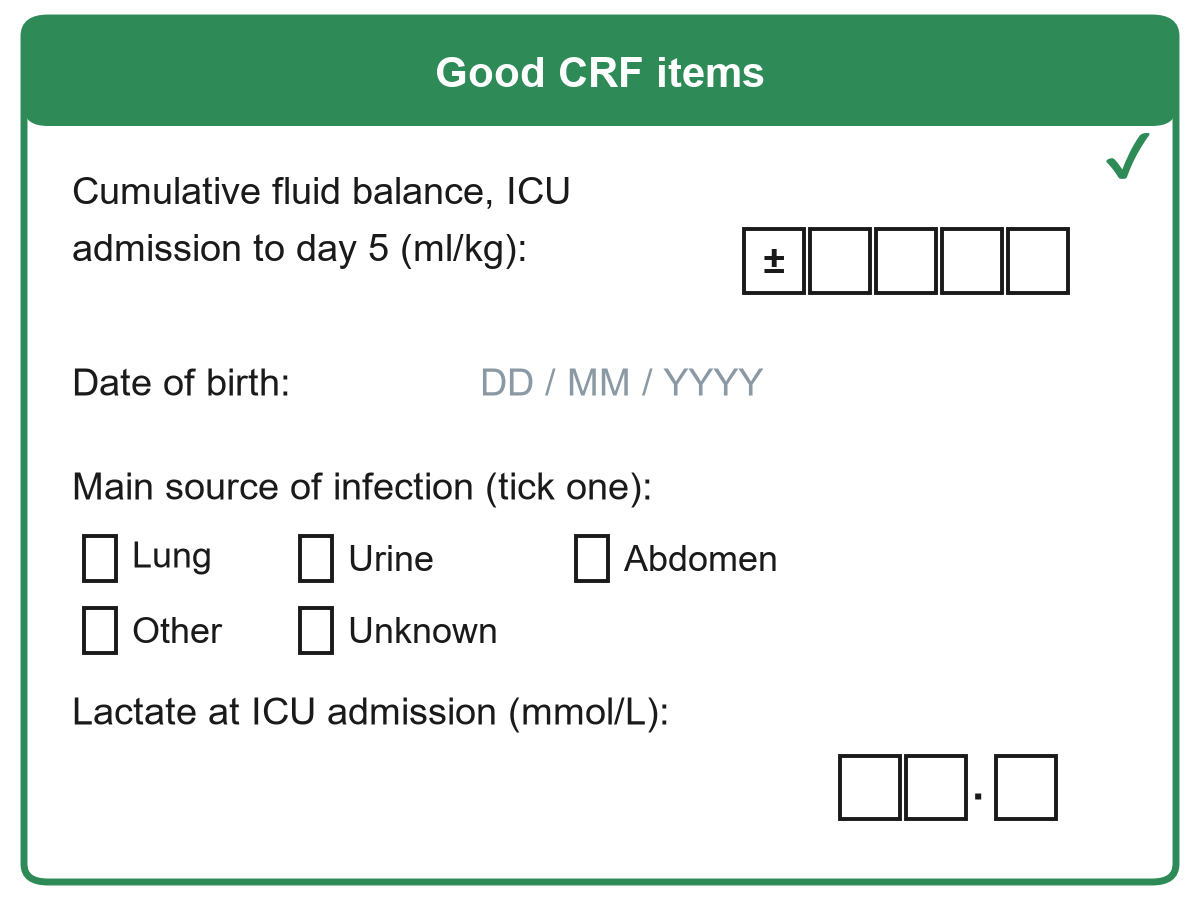
Clear: unit, time window, one answer, ‘unknown’

Worked example: from a question to one CRF item

The variable ‘cumulative fluid balance’ in five decisions.

What?

  • Fluid in minus fluid out
  • All routes, including drug diluents

When?

  • From ICU admission to the end of day 3

Unit?

  • ml per kg of admission weight

Format?

  • A number with a +/- sign
  • One box per digit

Missing?

  • A ‘not recorded’ box
  • A reason for the gap

KEY MESSAGE Answer what, when, unit, format and missing before the first patient.

Five rules for a good CRF

Write the form before the first patient, then test it on five patients.

Only what you need

  • Every item links to an objective
  • Short forms get completed

One question, one answer

  • No double questions
  • Objective, not opinion

Units and timing

  • ml/kg, mmol/L
  • ‘at ICU admission’, ‘day 5’

Closed answers

  • Tick boxes
  • Include ‘other’ and ‘unknown’

Pilot it

  • Two people, same patient
  • Do they agree?

KEY MESSAGE If two colleagues can fill an item differently, rewrite it.

The data dictionary: one row per variable

Variable name Label (meaning) Type Unit / codes Allowed values
fb_d5 Cumulative fluid balance, day 5 Continuous ml/kg -100 to 300
age Age at ICU admission Continuous years 18 to 110
sex Sex Binary 1 = male, 2 = female 1, 2
src Main source of infection Nominal 1 lung, 2 urine, 3 abdomen, 4 other, 9 unknown 1 to 4, 9
died28 Died by day 28 Binary 0 = alive, 1 = died 0, 1

Example rows for the fluids-in-septic-shock study. The data dictionary is the instruction manual for your dataset.

Data validation: let the rules catch the errors

Four simple checks catch most data-entry errors.

Range check

  • Age = 230
  • Allowed: 18 to 110

Consistency check

  • Discharge 02/03, admission 05/03
  • Discharge must come after admission

Logic check

  • Sex = male, pregnant = yes
  • An impossible combination

Completeness check

  • Day-28 status left blank
  • A required field: chase it now

KEY MESSAGE Check data while the patient is still in the unit, not a year later.

Data management in practice: from bedside to database

Two safe routes from the patient to one secure database.

Paper CRF

  • Double data entry: two people type each form
  • A computer compares the two copies
  • Mismatches are fixed from the paper form

Electronic data capture (EDC)

  • Form on a tablet or computer
  • For example REDCap or KoBoToolbox
  • Range, logic and required-field checks at entry

Secure database

  • Coded study IDs, no names
  • Audit trail: who changed what, when and why
  • Example: lactate 21 corrected to 2.1, ‘typo’

KEY MESSAGE Check at entry, enter twice if on paper, and log every change.

Missing data: why it matters

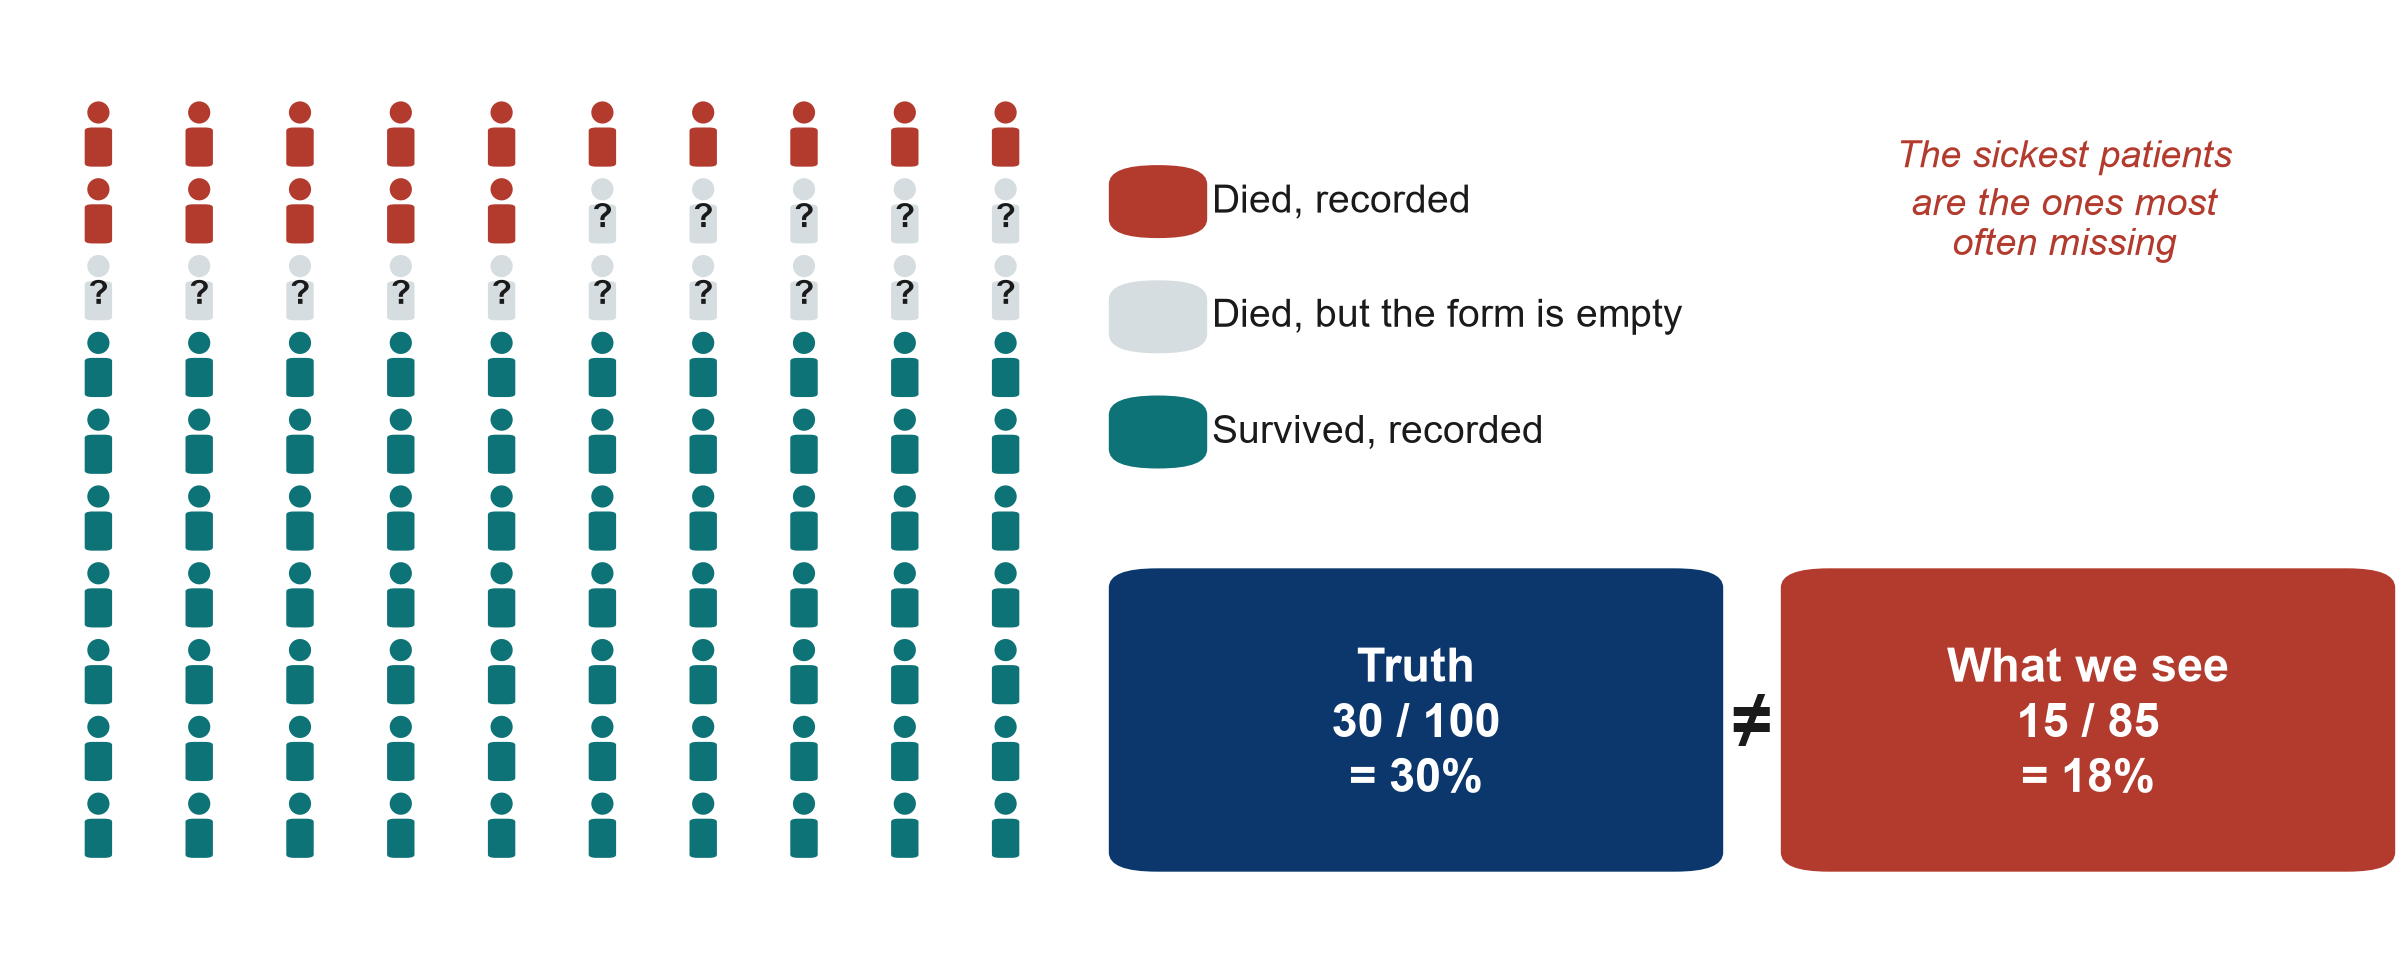
KEY MESSAGE Missing data are rarely random: the sickest patients go missing first.

Missing data: how to prevent it

Prevention is the only reliable cure.

Fewer items

  • Collect only what you need
  • Short forms get finished

Clear form

  • Required fields marked
  • ‘Not done’ and ‘unknown’ options

Train

  • Train every data collector
  • Same rules, same definitions

Check weekly

  • A completeness report
  • Who and what is missing?

Chase early

  • Fix while the chart is on the ward
  • Plan follow-up for transfers

KEY MESSAGE Plan who completes, checks and chases each form before you start.

Fix the CRF items together

WHOLE-CLASS TASK · 7 min

  • Open the Session 5 exercise sheet (PDF sent before the session), Exercise 2: four unclear CRF items
  • The instructor shows one item at a time on the shared screen
  • Rewrite each item, then two or three people read theirs aloud (1 minute per item)
  • The instructor builds the class version live, using the four checks
  • Items we do not reach, and Exercise 1 (classify 10 variables), are homework

The four checks

  • Unit in the question?
  • Time point in the question?
  • One answer only?
  • ‘Unknown’ option?

OUTPUT Rewritten CRF items agreed by the whole class

5.2 Meet the course dataset

One realistic dataset, five research questions.

5.2 Meet the course dataset FLUID-ICU | 25 minutes

FLUID-ICU at a glance (simulated cohort)

A multicentre prospective cohort in 4 intensive care units (ICUs), January 2023 to December 2024.

Who

  • 620 adults with sepsis
  • ICU A 191, ICU B 164, ICU C 147, ICU D 118

Exposure

  • Cumulative fluid balance by day 3 (ml/kg)
  • Positive in 373/618 (60.4%)

Primary outcome

  • Death by day 28: 179/620 (28.9%)
  • Time to death also recorded

Also recorded

  • Severity scores (SOFA, APACHE II)
  • Lactate
  • Acute kidney injury (AKI)
  • Ventilator-free days, ICU stay

KEY MESSAGE Question: is a positive fluid balance by day 3 associated with 28-day death?

From 623 rows to 527 complete cases

FLUID-ICU (simulated): who is included at each step, and why not.

Raw file

  • 623 rows
  • Minus 3 duplicate records

Enrolled

  • 620 patients
  • Minus 2 without a day-3 fluid balance

Exposure analysis

  • 618 patients (Table 1, comparisons)
  • Minus 91 without lactate (or age)

Complete cases

  • 527 patients
  • Used for the adjusted model

KEY MESSAGE Every paper reports this flow: who was included at each step, and why not.

Raw vs clean: what the four ICUs actually sent

Problem Raw file (as sent) Clean file (01_clean.R)
Sex 8 spellings: M, m, male, F, f … Male / Female
Yes / No Yes, Y, yes, 1 | No, N, no, 0 Yes / No
Admission date 2023-03-14 | 14/03/2023 | 14-Mar-2023 2023-03-14
Lactate, ICU C 23.4 (mg/dL) 2.6 (mmol/L)
Missing codes 999 | -99 missing (NA)
Impossible age 210 | weight 7 kg | output -2990 ml missing + query to site
Duplicates 623 rows (3 IDs twice) 620 patients

KEY MESSAGE Real data arrive messy: clean them with a script, never by hand.

Live demo: cleaning FLUID-ICU in R

LIVE DEMO · 8 min

  • Open FLUID-ICU.Rproj and the script 01_clean.R
  • Read the raw file as text and look at it
  • Run one block per problem: names, duplicates, sites, dates, codes
  • Find the lactate unit problem with a summary by ICU
  • Last block: the cleaned file is identical to the reference file

Watch for

  • One problem, one block
  • The raw file is never changed
  • Every step goes in the log
  • Re-run = same result

OUTPUT Everyone has seen raw data become clean, reproducibly

The cleaning log: the audit trail of the data

Course/Data/cleaning_log.md: one row for every change made to the raw data.

The rule

  • Never edit the raw file
  • Every change is made by the script and logged

Each row says

  • The problem found
  • How many records
  • What we did and why

Queries

  • Impossible value set to missing
  • Query sent to the site
  • The patient stays in

What is left

  • Real missing values
  • Lactate: 93/620 (15.0%)
  • Others: 1% or less

KEY MESSAGE A reviewer must be able to trace every number back to the raw data.

Five questions, one dataset

In class we work through all five together. For your manuscript, you choose one.

Q1 Mortality

  • Positive balance and 28-day death
  • Logistic regression
  • Kaplan-Meier and Cox

Q2 Kidneys

  • Fluid balance and acute kidney injury (AKI)
  • Logistic regression

Q3 Ventilation

  • Fluid balance and ventilator-free days
  • Mann-Whitney and linear regression

Q4 Lactate

  • Lactate and 28-day death
  • Missing lactate: complete case vs multiple imputation

Q5 ICU stay

  • Fluid balance and ICU stay in survivors
  • A skewed outcome

KEY MESSAGE We give you the results. You write the paper on the question you choose.

Question 1 as a PECO sentence, together

WHOLE-CLASS TASK · 4 min

  • Open the Q1 results pack (PDF sent before the session), page 1
  • Question for the class: what is the outcome, and what type is it?
  • Question for the class: what is the exposure, and what type is it?
  • The instructor writes Q1 as one PECO sentence on the shared screen
  • Q2 to Q5: outcome and exposure types, one line each

PECO for Q1

  • P (population): adults with sepsis in ICU
  • E (exposure): positive balance by day 3
  • C (comparison): negative balance
  • O (outcome): death by day 28 (binary)

OUTPUT Q1 as one PECO sentence, with outcome and exposure types (Exercise 7)

Break

15 min

5.3 Describing and showing data

Before comparing groups, describe them.

5.3 Describing and showing data | 35 minutes

Worked example: mean and median by hand

ICU stay of 7 patients (days): 1, 2, 2, 3, 4, 6, 24

Line up

  • Sort from the shortest to the longest stay

Median

  • The 4th of 7 patients: 3 days

Mean

  • 42 days / 7 patients = 6 days

Compare

  • One 24-day stay doubles the mean

KEY MESSAGE One very long stay moves the mean a lot and the median not at all.

Mean or median? Look at the shape first
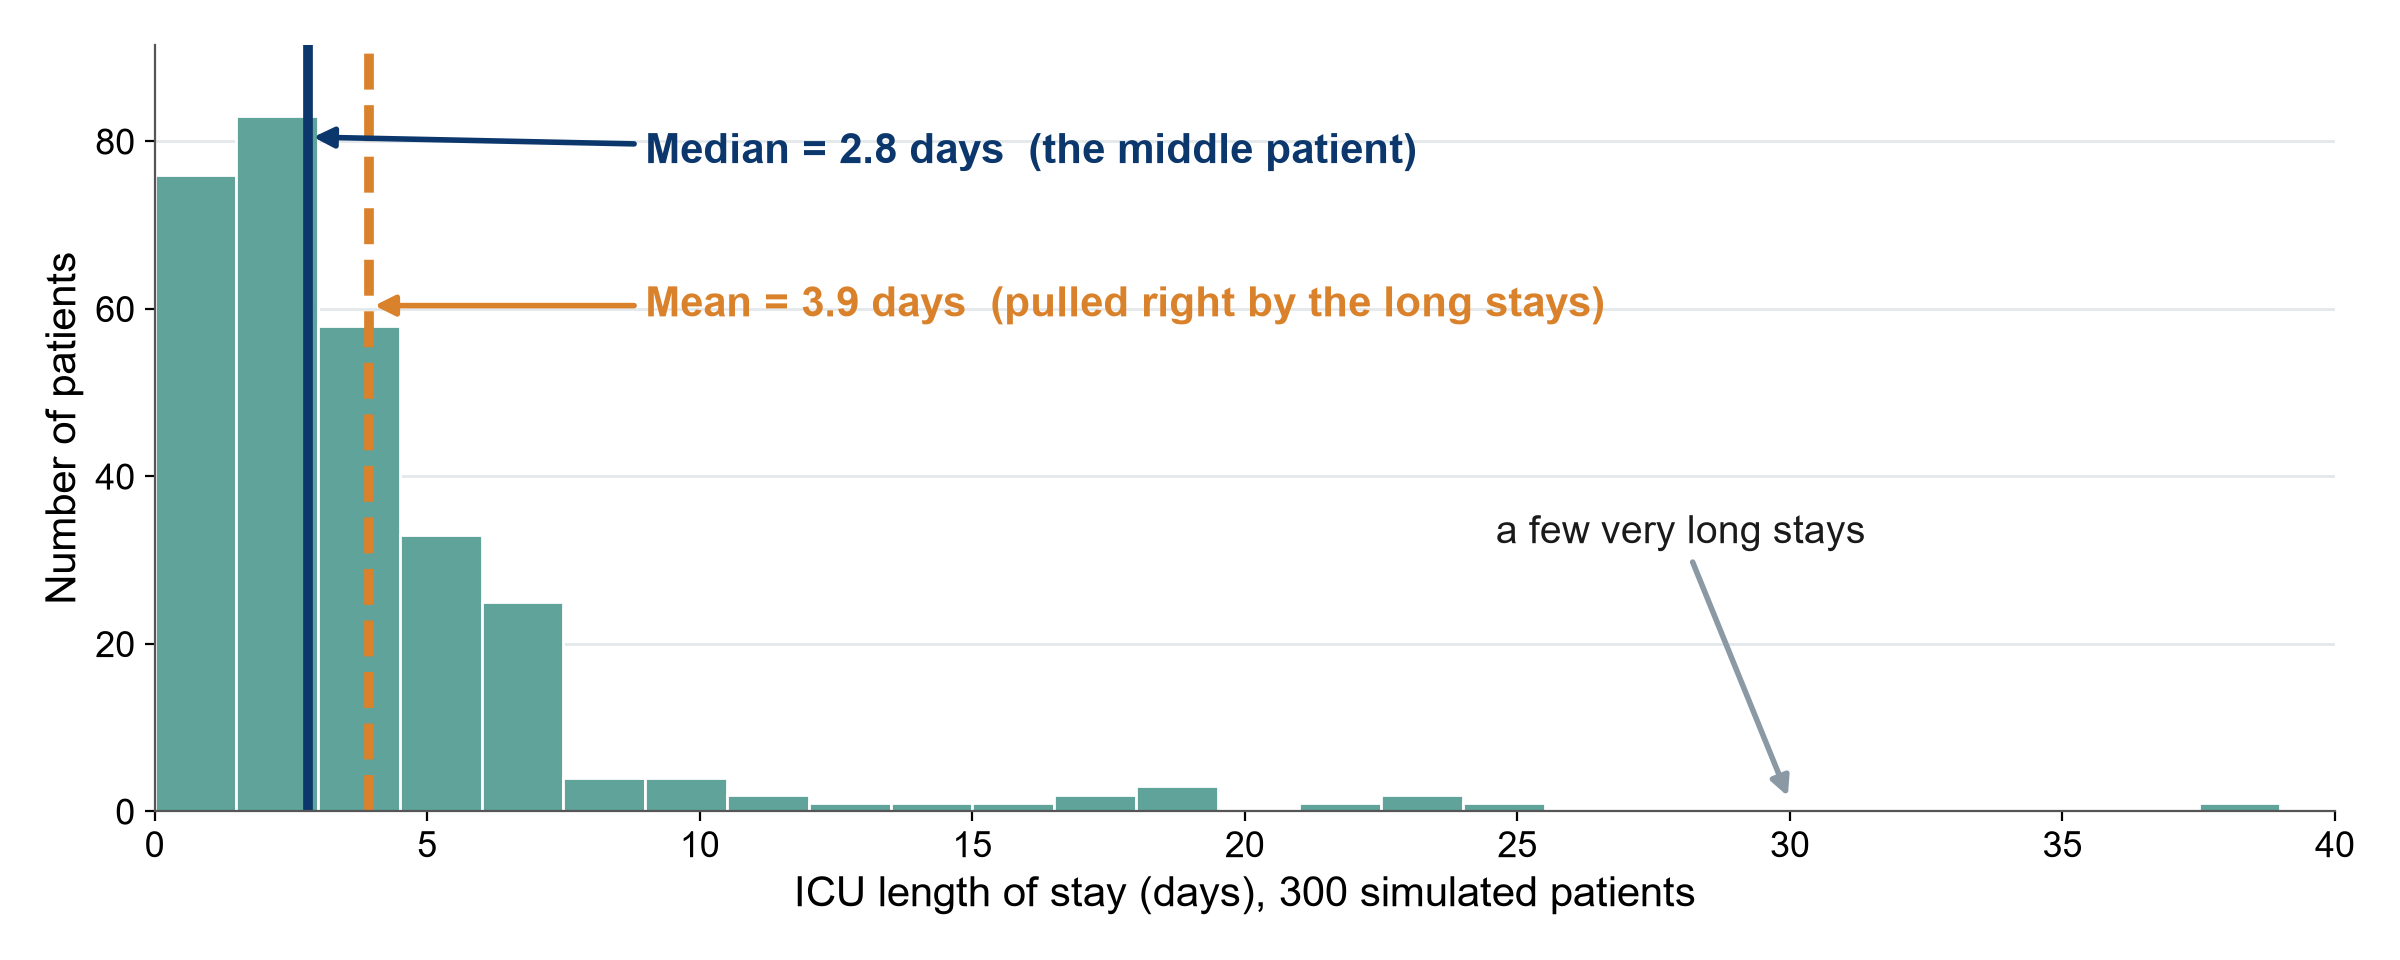
KEY MESSAGE For skewed data like length of stay, the median describes the typical patient.

Spread: SD for symmetric, IQR for skewed
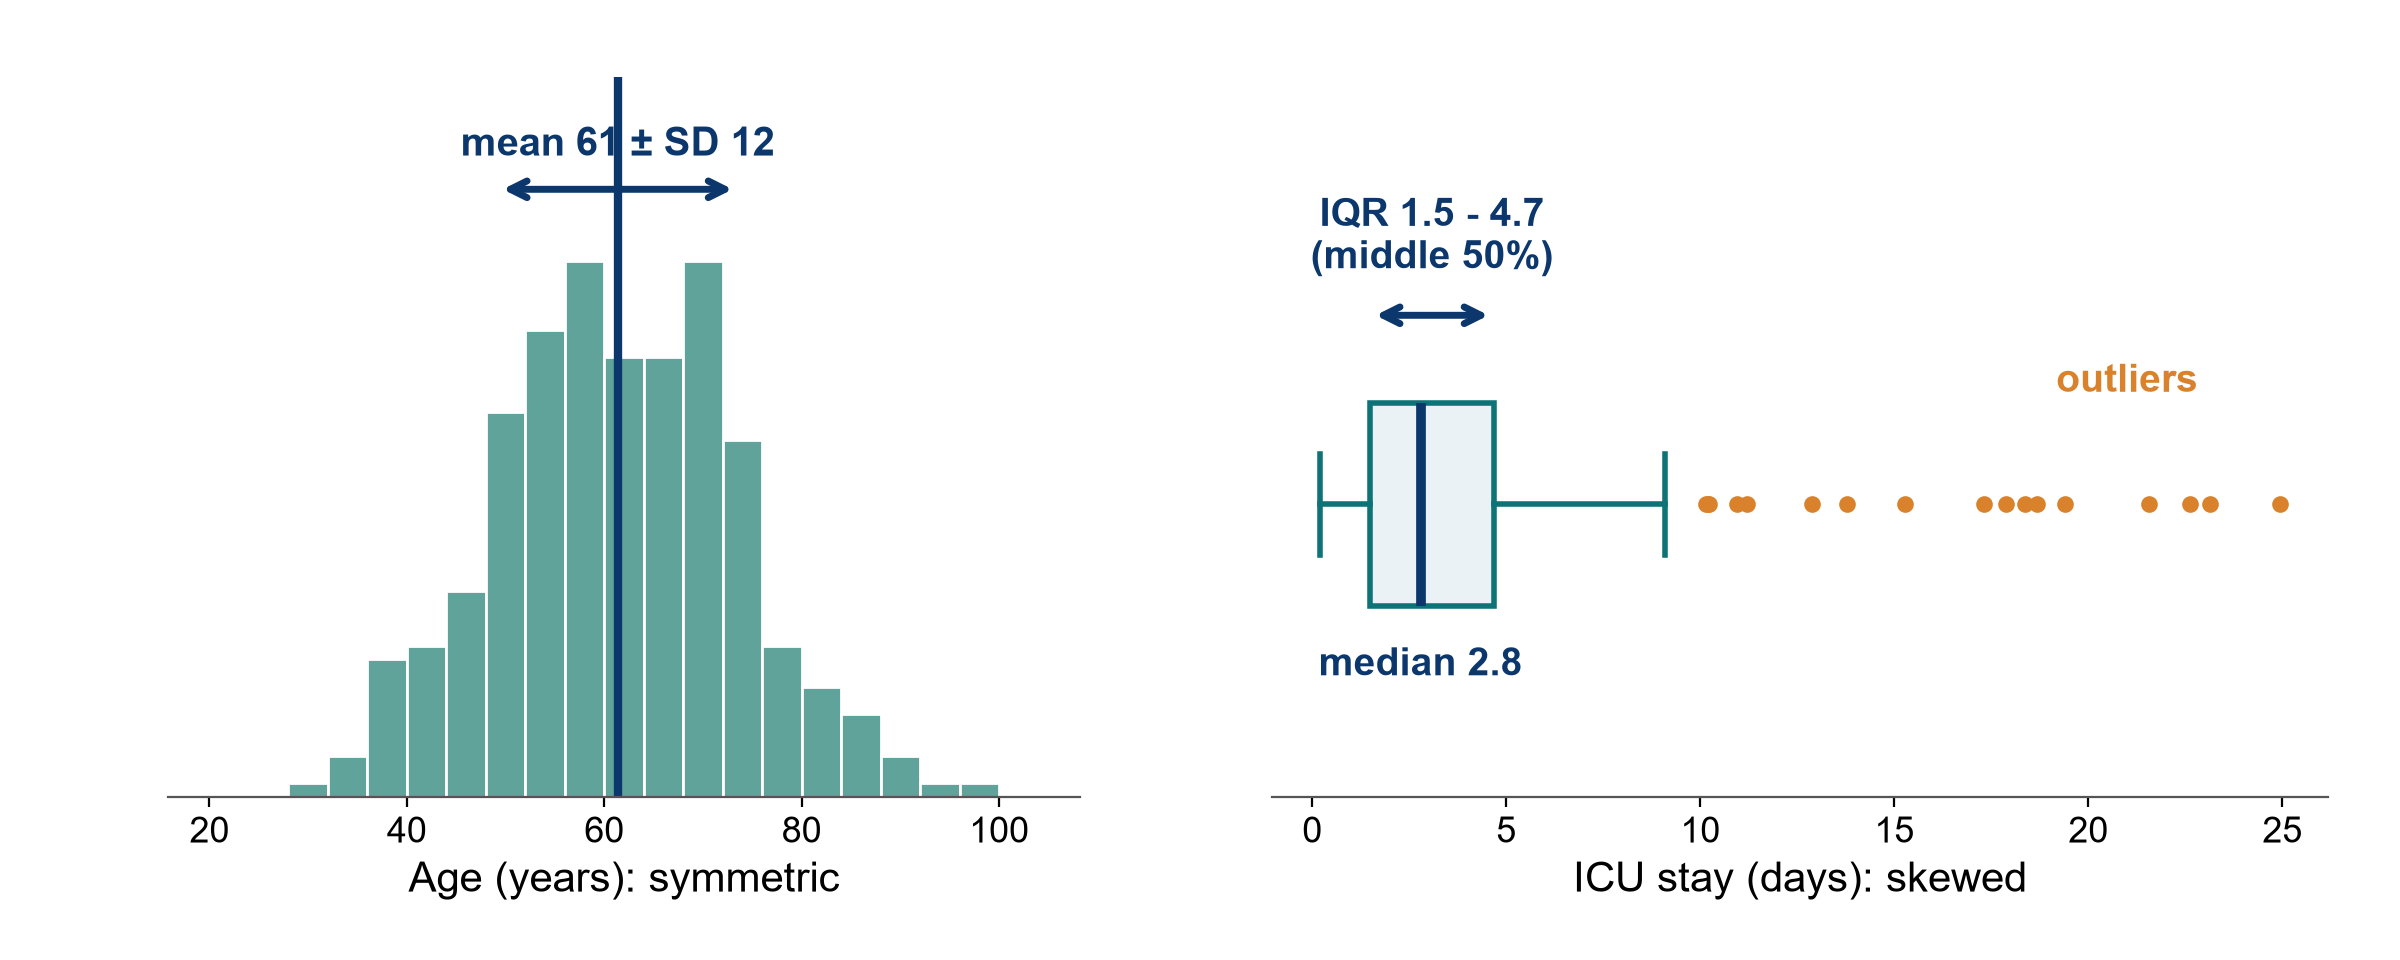
KEY MESSAGE Report mean (SD) or median (IQR): never mix the pairs.

Why these two shapes? They cover most clinical data
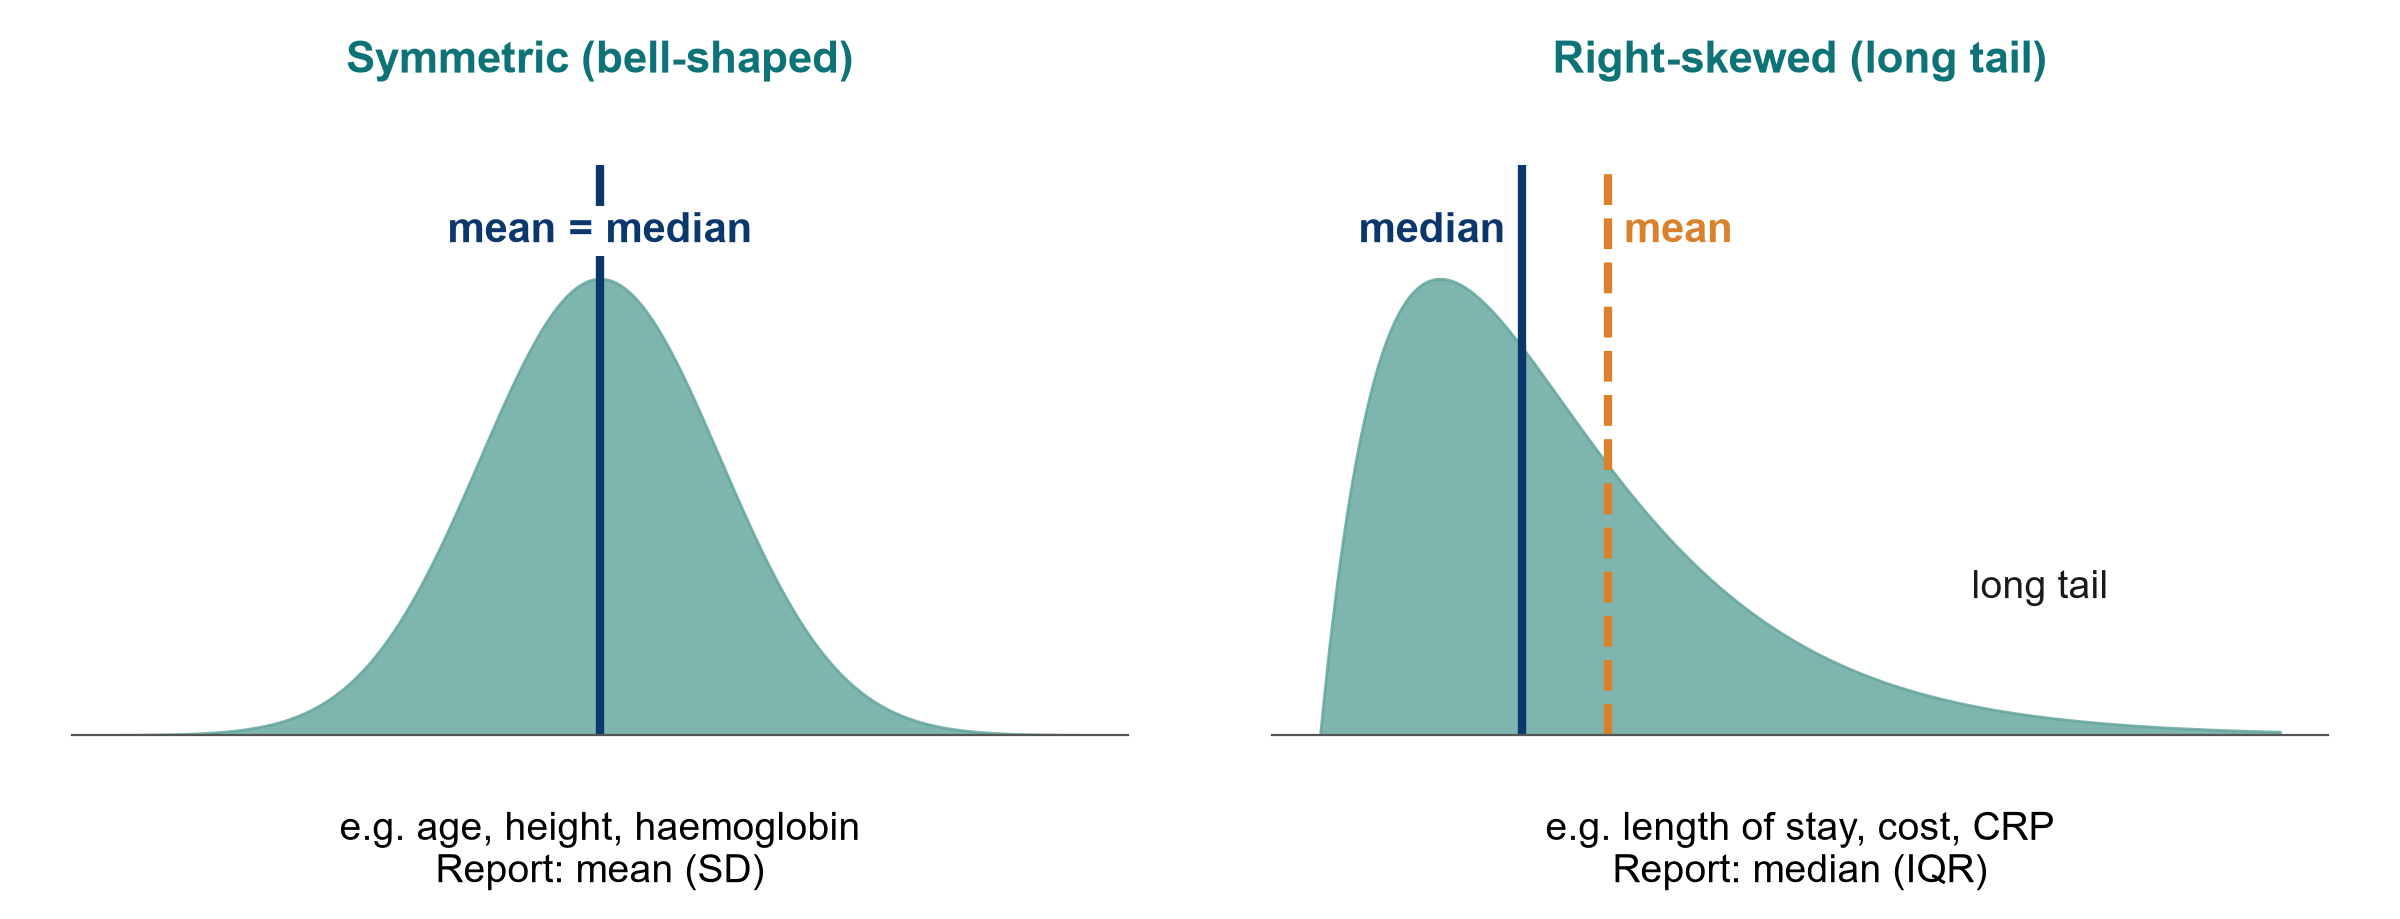
KEY MESSAGE Most clinical data cluster around a typical value or have a long tail. Check which.

Check your understanding: which summary?

QUICK QUIZ · 3 min

  • ICU length of stay in 200 patients: mean (SD) or median (IQR)?
  • Age of 200 adult ICU patients, bell-shaped: mean (SD) or median (IQR)?
  • Ventilated on admission (yes/no): which summary?
  • Acute kidney injury (AKI) stage 1 to 3: which summary and which graph?

Answers

  • Length of stay: median (IQR)
  • Age: mean (SD)
  • Ventilated: n (%)
  • AKI stage: n (%) per stage, bar chart

OUTPUT Every participant can pick the right summary for a variable type

Which graph for which data?

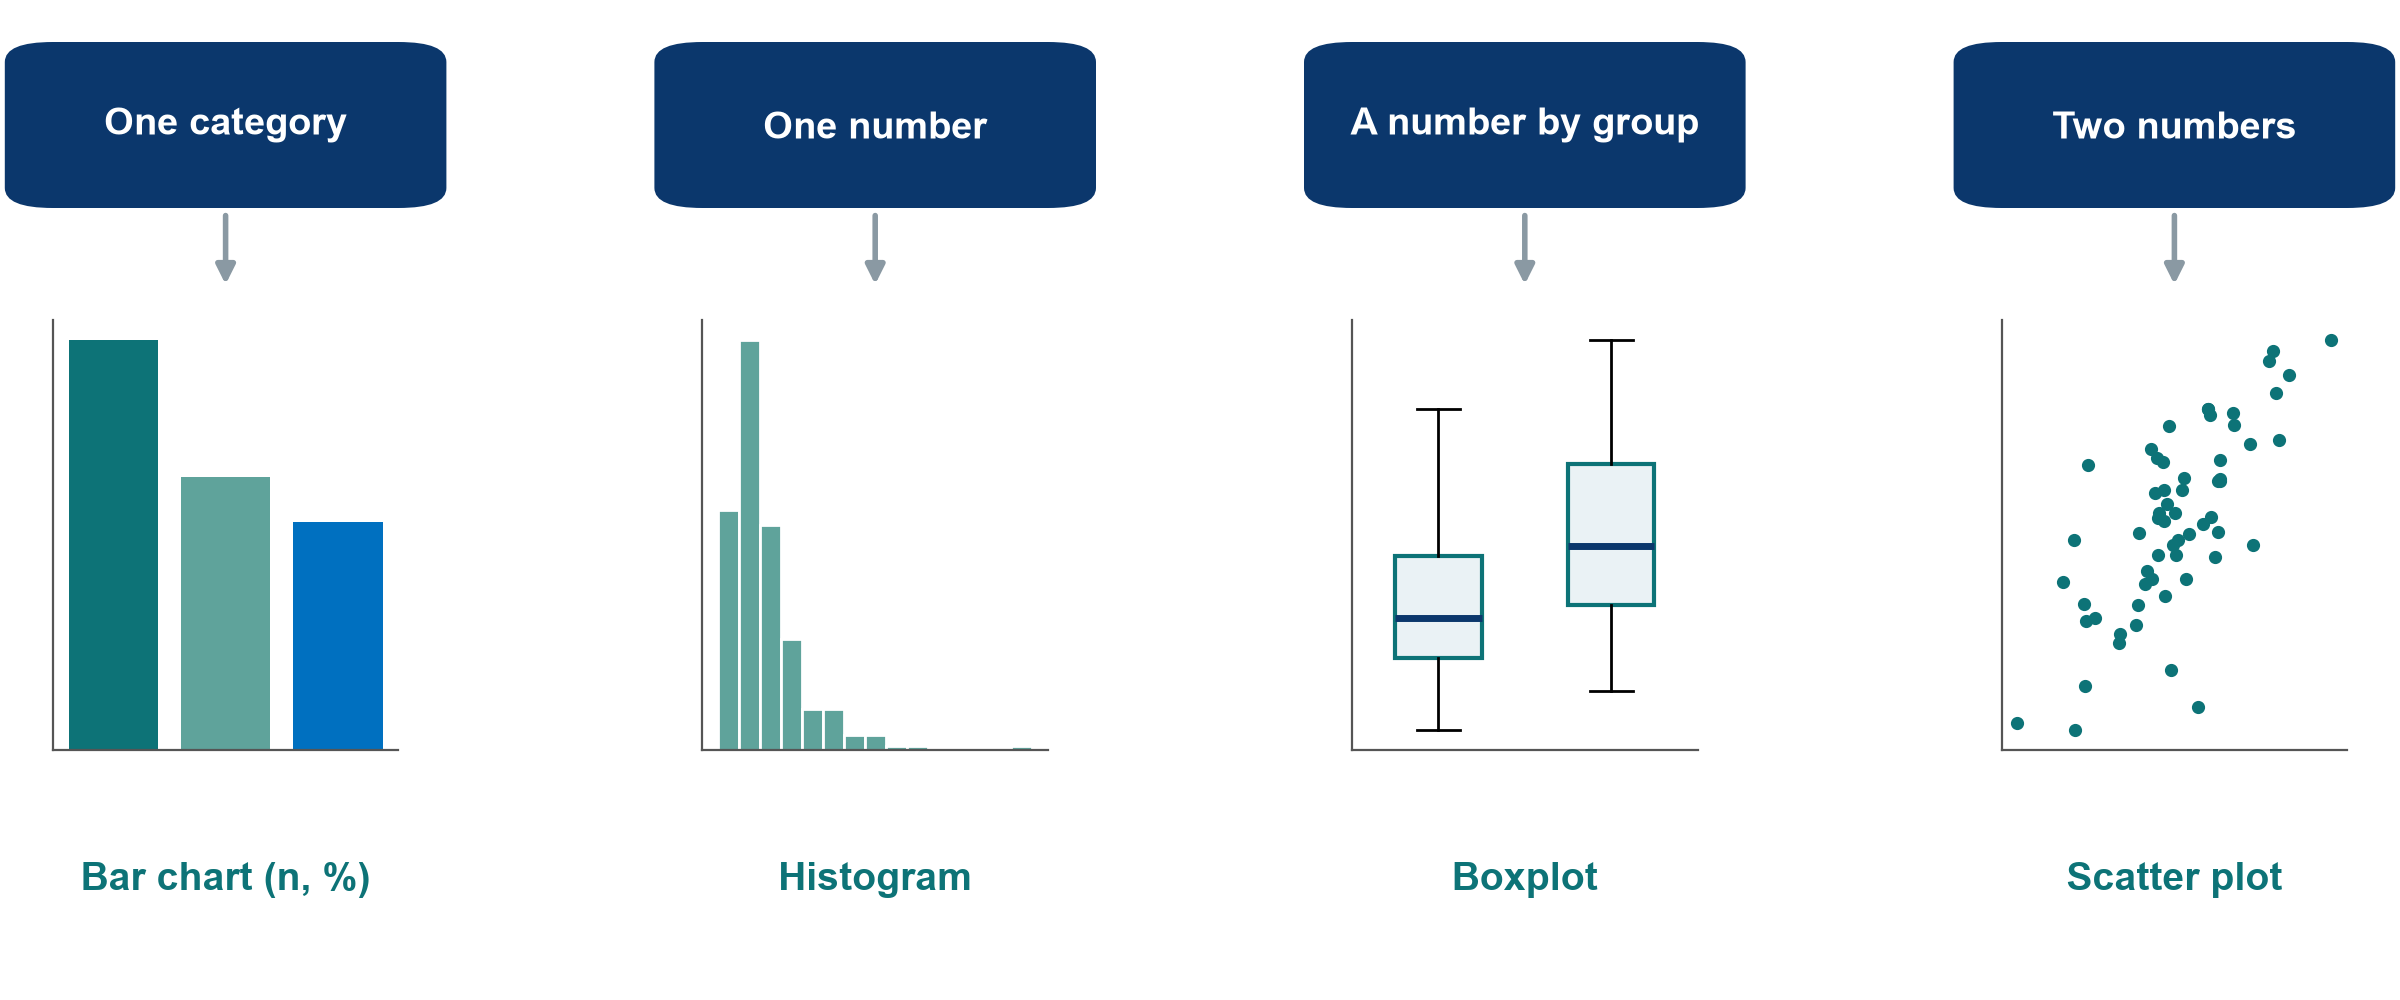
KEY MESSAGE Choose the graph from the variable type, not from the software menu.

Show the data: dynamite plot vs dots + box

Same 48 patients, two pictures.
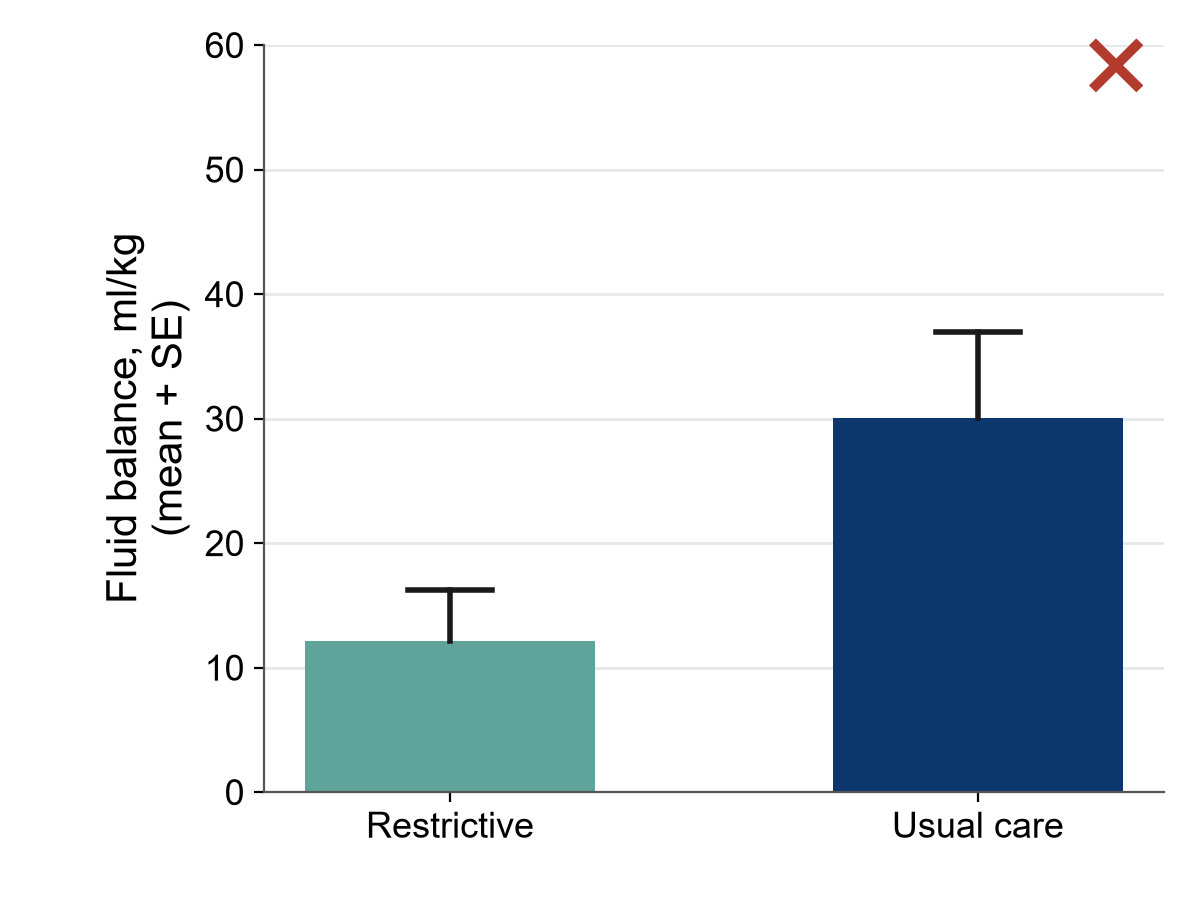
Dynamite plot: a mean and an error bar hide everything
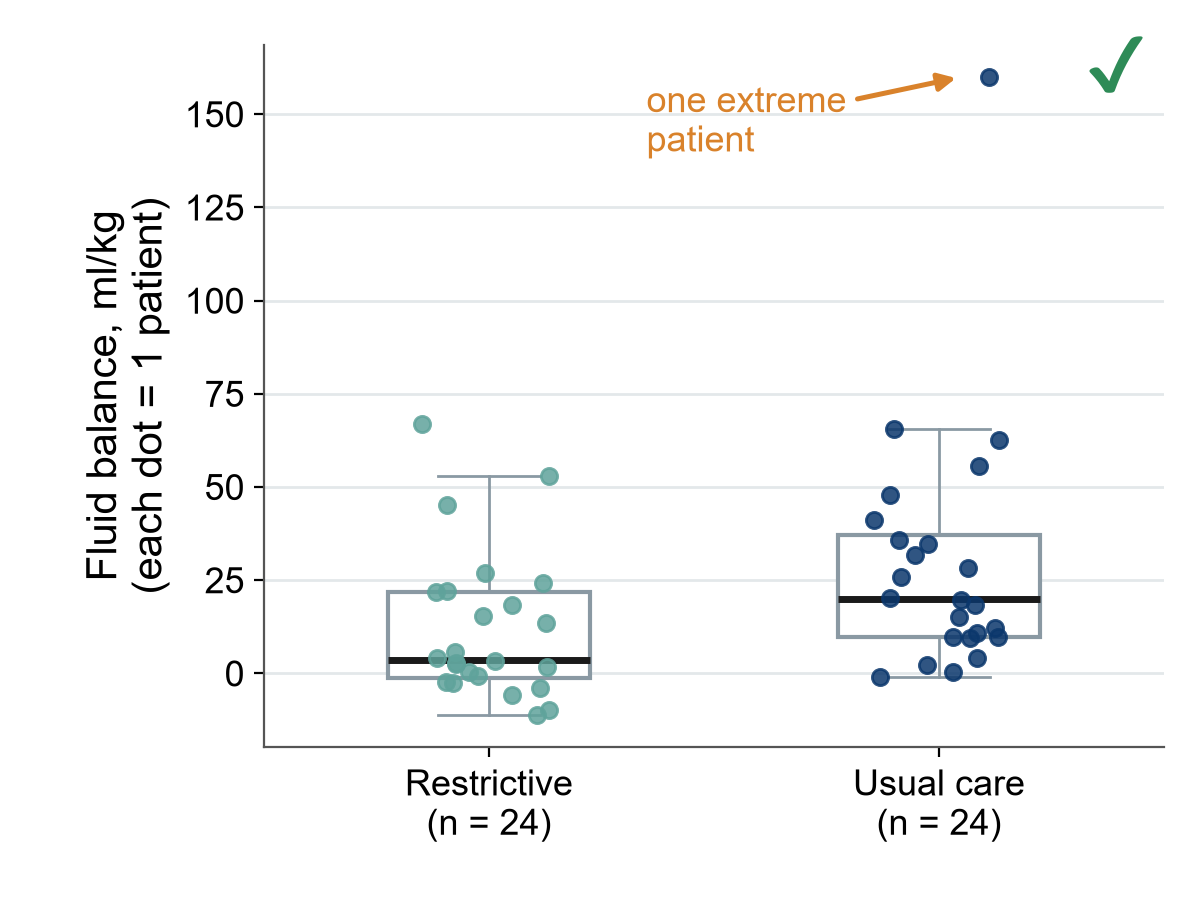
Every patient visible: shape, spread and the outlier

What a ‘Table 1’ shows

Characteristic Restrictive (n = 24) Usual care (n = 24)
Age, years, mean (SD) 64 (11) 66 (12)
Male, n (%) 15 (63) 16 (67)
SOFA score, median (IQR) 9 (7-11) 9 (6-12)
Lactate, mmol/L, median (IQR) 3.1 (2.2-4.8) 2.9 (2.0-5.1)
Source: lung, n (%) 11 (46) 10 (42)

Illustrative numbers. Symmetric: mean (SD). Skewed: median (IQR). Categories: n (%). SD = standard deviation. IQR = interquartile range. SOFA = Sequential Organ Failure Assessment. Ask: who were the patients, and were the groups alike at the start?

Publication-quality tables: bad vs good

Rules: units and summary in the row label, n per column, consistent decimals, footnotes.
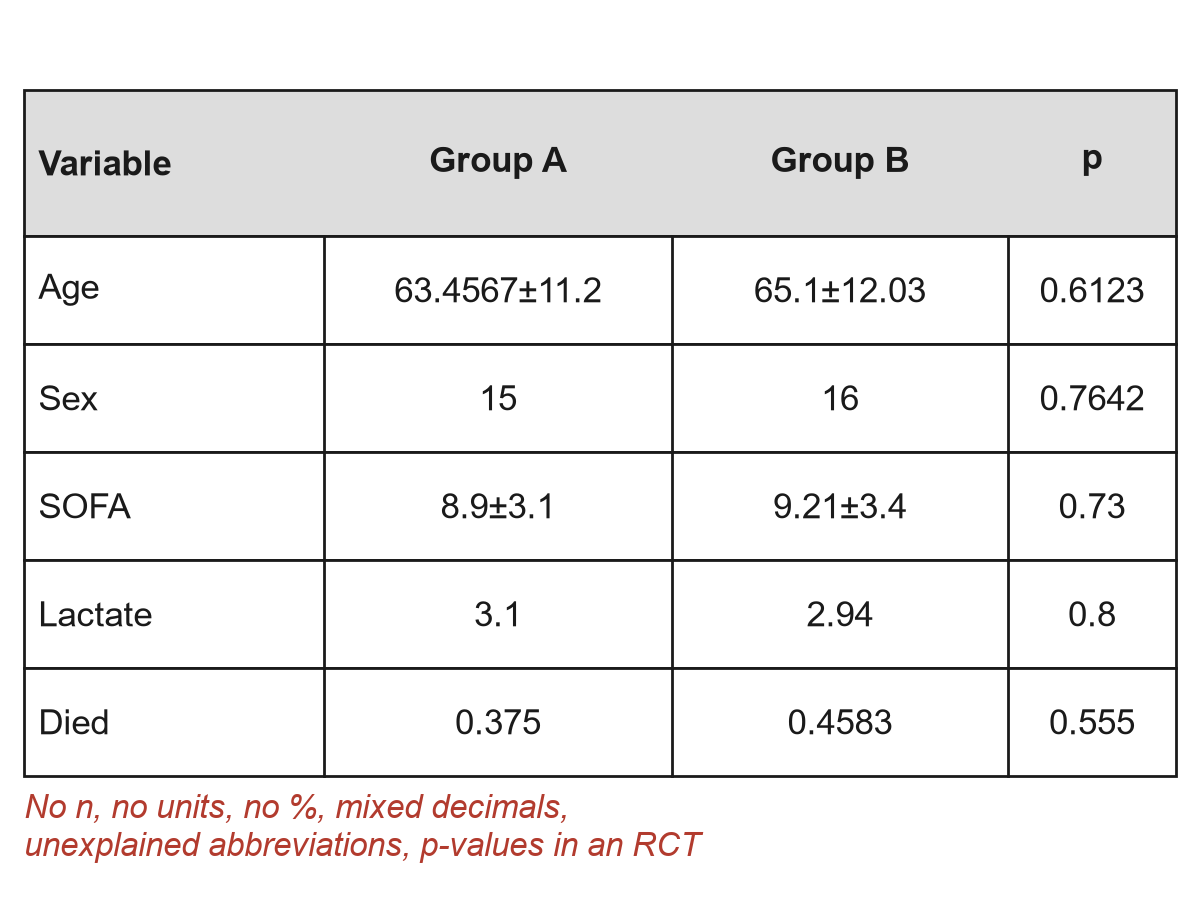
Grid lines, no n, no units, 4 decimals
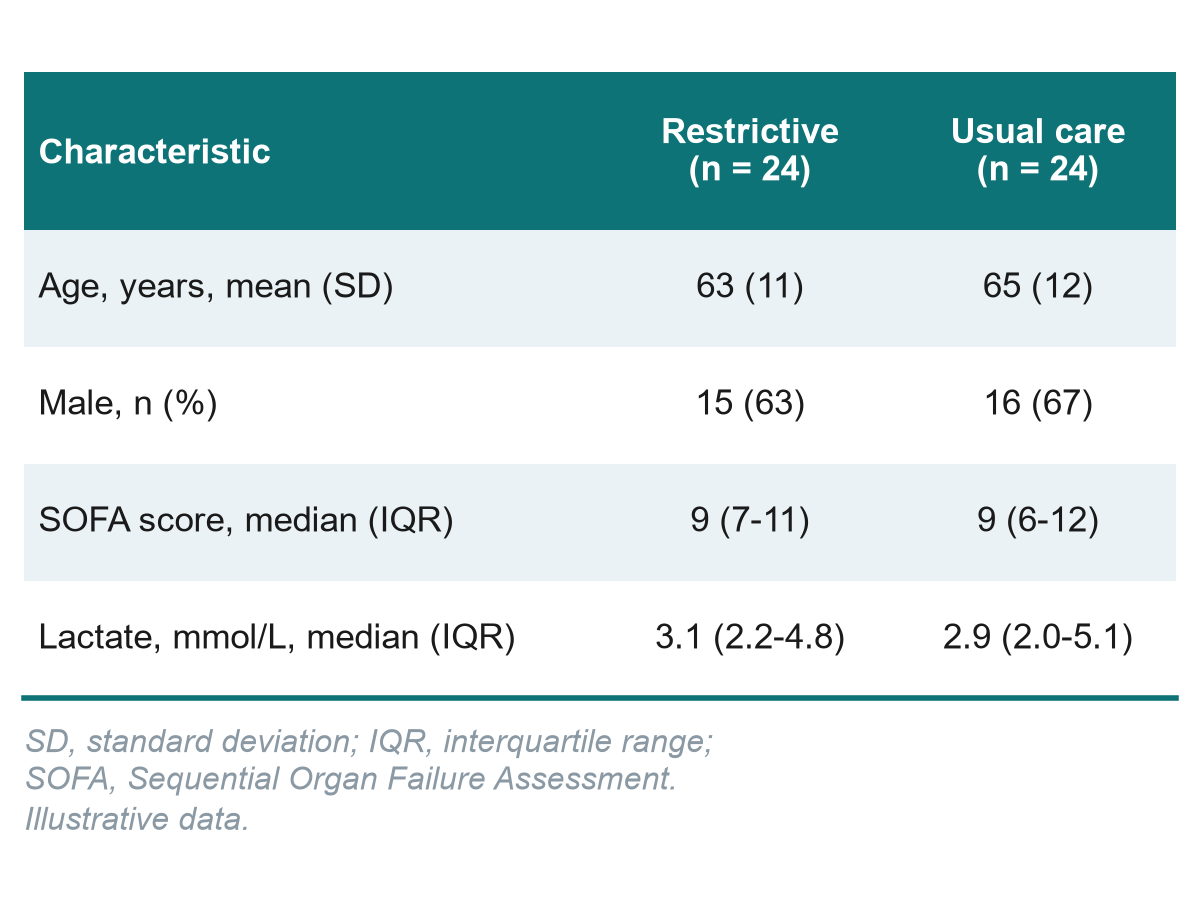
Clean, self-explanatory, ready for a journal

5.4 Describe the course dataset

Before comparing groups, describe them: now with real numbers.

5.4 Describe the course dataset | 25 minutes

Live demo: Table 1 and figures in R

LIVE DEMO · 6 min

  • Open 02_describe.R and load the clean data
  • Look at the shape first: histograms of age, lactate, ICU stay
  • Build Table 1 by fluid-balance group (no p-values)
  • Draw the figures: histogram, boxplot, bar chart
  • Save tables and figures for the results packs

Same rules as 5.3

  • Shape decides the summary
  • n per column
  • Units in the row label
  • Missing reported

OUTPUT Everyone has seen a Table 1 built from data, reproducibly

FLUID-ICU Table 1: were the groups alike at the start?

Characteristic | Overall

n = 618 | Negative balance n = 245 | Positive balance n = 373 | |:—|:—|:—|:—| | Age, years, mean (SD) | 62.6 (15.2) | 64.6 (15.0) | 61.4 (15.2) | | Male sex, n (%) | 375 (61%) | 143 (58%) | 232 (62%) | | Heart failure, n (%) | 97 (16%) | 54 (22%) | 43 (12%) | | SOFA score, median (IQR) | 7 (5, 9) | 6 (4, 8) | 8 (6, 10) | | Lactate, mmol/L, median (IQR) | 2.6 (1.7, 3.7) | 2.2 (1.4, 3.0) | 2.9 (1.9, 4.0) | | Vasopressor, n (%) | 266 (43%) | 61 (25%) | 205 (55%) | | Mechanical ventilation, n (%) | 313 (51%) | 97 (40%) | 216 (58%) |

KEY MESSAGE The positive-balance group was sicker at baseline: a warning for Session 6.

The exposure: cumulative fluid balance at day 3
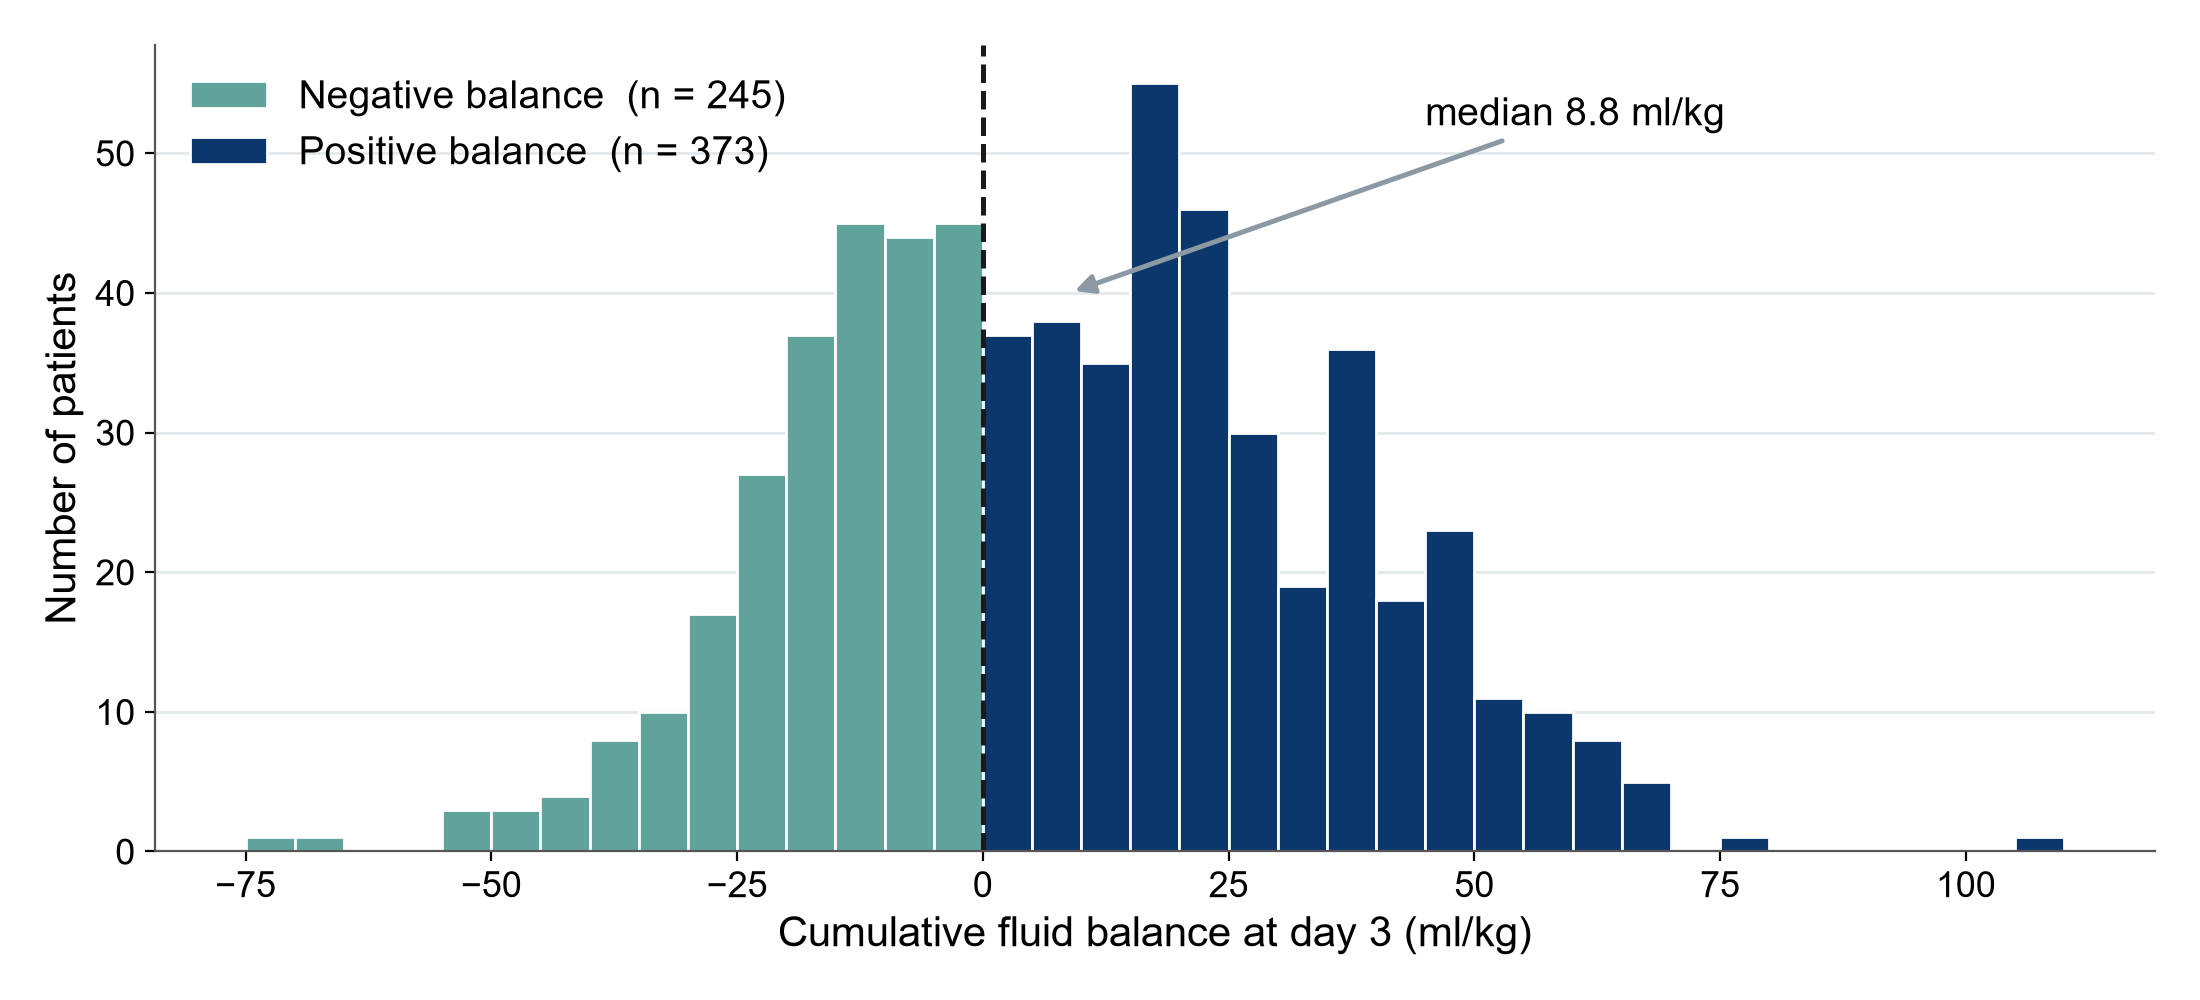
KEY MESSAGE A continuous exposure, cut at 0 ml/kg into negative and positive balance.

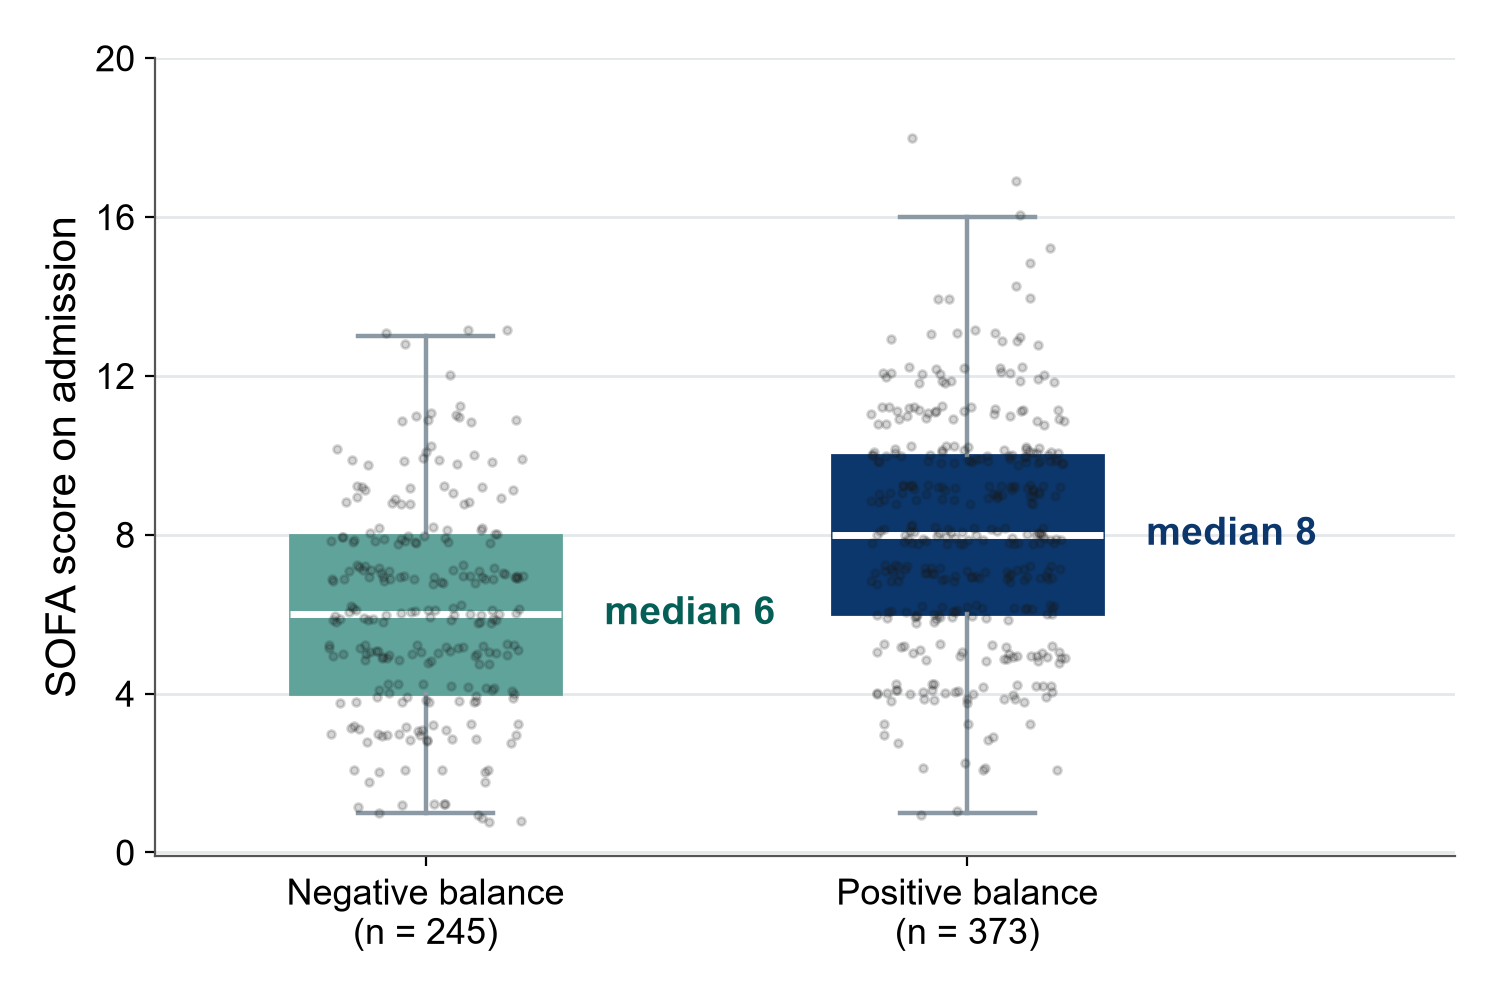
Severity by group: show every patient

How to read it

  • Each dot is one patient
  • Box = middle 50%
  • Median SOFA 6 vs 8
  • Sicker patients got more fluid

KEY MESSAGE Dots plus box show the overlap and the shift: confounding you can see.

The skewed outcome: ICU stay in survivors (Q5)
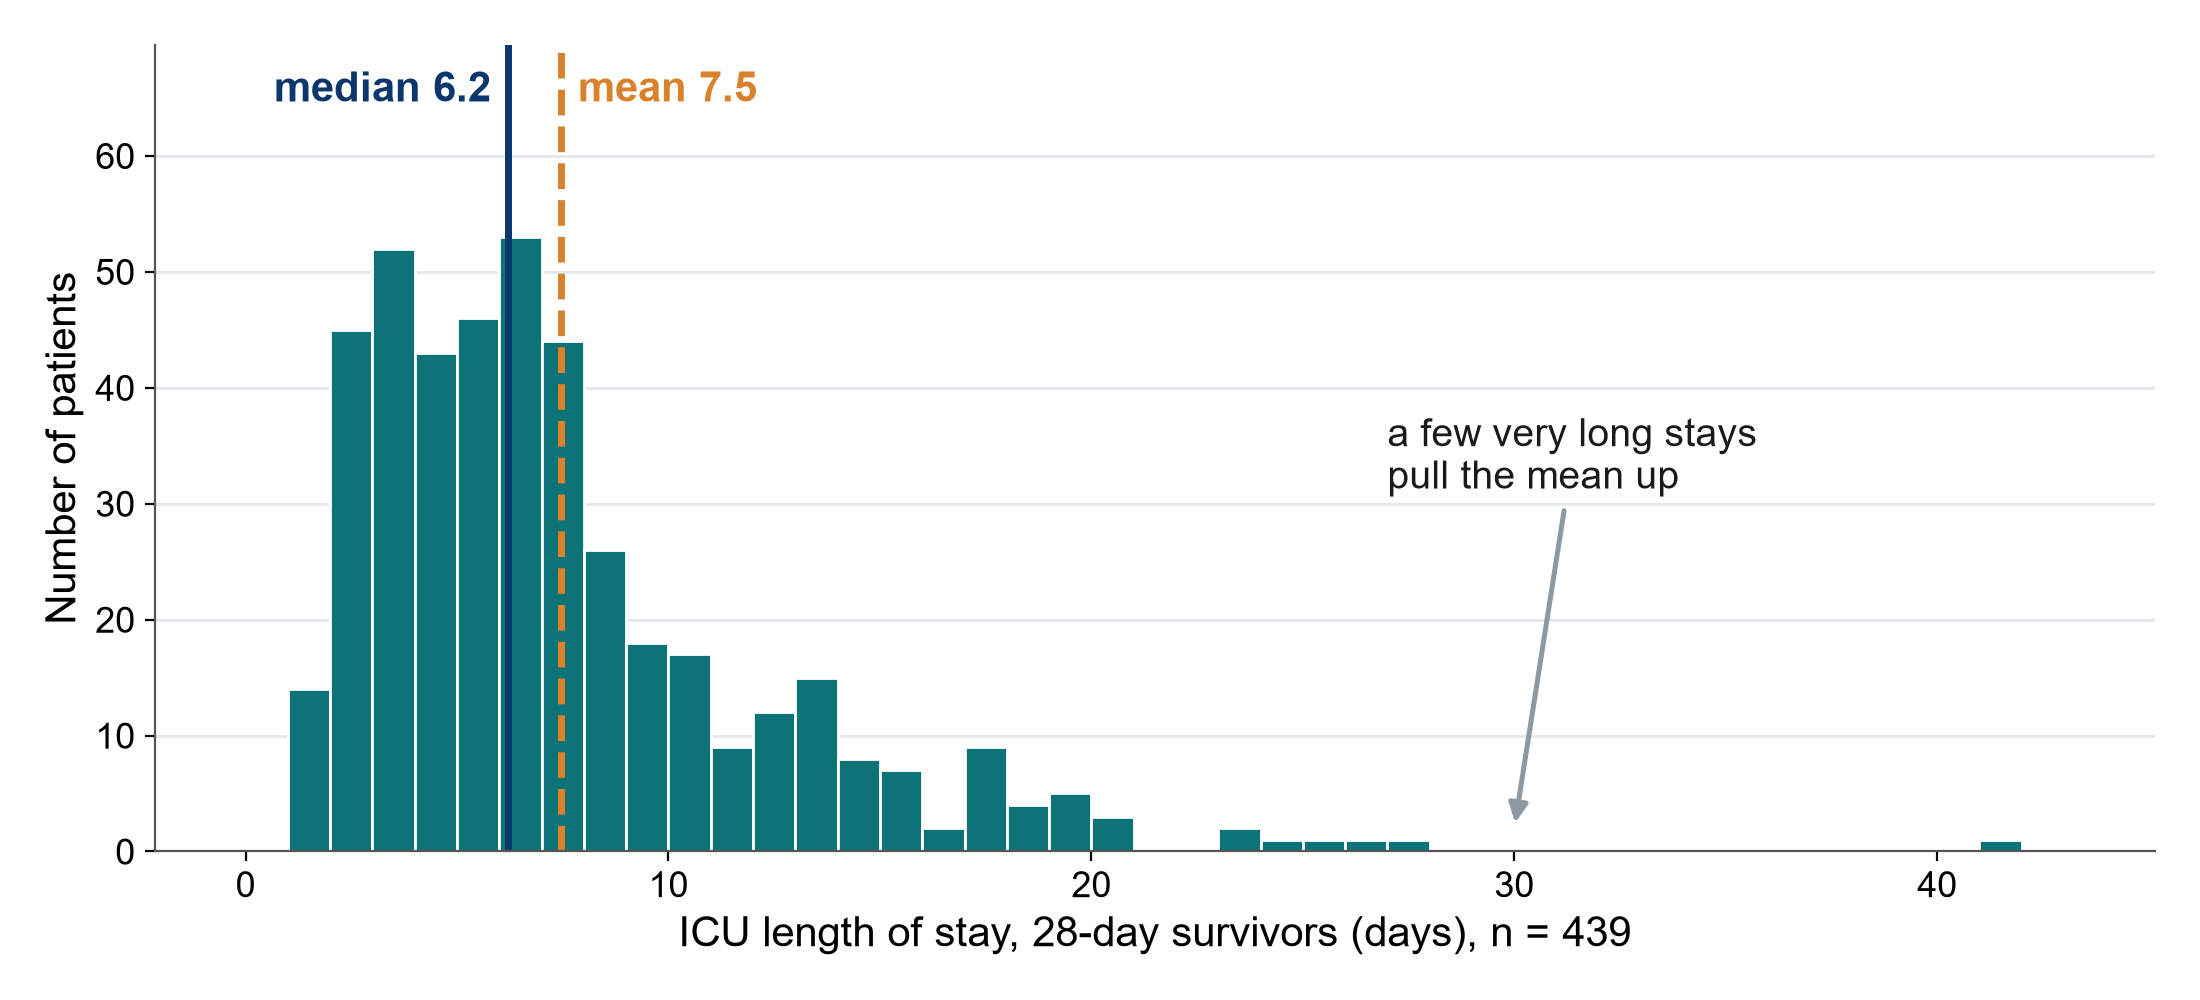
KEY MESSAGE Mean 7.5 vs median 6.2 days: report the median and IQR.

Read the FLUID-ICU Table 1 together

WHOLE-CLASS TASK · 10 min

  • Open Table 1 in the Q1 results pack (PDF): the same table is in every pack
  • Poll: which summary is used for age, SOFA and vasopressor, and why?
  • Question for the class: were the groups alike at the start? Name the biggest difference
  • Together we write two Results sentences describing the patients
  • Q2 to Q5: what each pack adds (for example, Q5 has a survivors-only table)

Check

  • n per column?
  • Units in labels?
  • Median for skewed?
  • Missing reported?

OUTPUT Two Results sentences describing the FLUID-ICU patients (Exercise 6)

Proposal builder 5: what a good one contains

Modelled on the running example (a restrictive fluids trial).

Variables table

  • Outcome: 28-day death (binary)
  • Exposure: restrictive vs usual
  • Confounders: age, SOFA, lactate

Mini-CRF

  • 6 to 10 items
  • Units and time points
  • ‘Unknown’ options

Data dictionary

  • 3 to 5 rows
  • Name, label, type, unit or codes
  • Allowed values

Data management

  • Electronic capture (EDC) or double entry
  • Coded IDs and an audit trail
  • Backups and a data-sharing statement

KEY MESSAGE Today: what you will collect and how you will keep it safe.

Proposal builder 5: variables, CRF and data management

PROPOSAL BUILDER · 30 min

  • The instructor models each part live on the running example (18 min)
  • Variables table, mini-CRF, data dictionary rows, data-management plan
  • Then draft your own variables table in your proposal template (10 min, on your own)
  • Questions (2 min): raise your hand or use the chat. The other parts are homework

Use these tools

  • Variable-type cards (5.1)
  • Good vs bad CRF items
  • FLUID-ICU data dictionary
  • Exercise sheet: Exercise 8

OUTPUT Your own proposal, Part 3 (first half): variables table started now, the rest as homework

Key words of the day

Twelve words you should now be able to explain to a colleague.

Collect

  • Variable type
  • CRF
  • Data dictionary

Protect

  • Validation check
  • Audit trail
  • Cleaning log

Describe

  • Median (IQR)
  • Mean (SD)
  • Skewed

Show

  • Table 1
  • Dots + box
  • n (%)

KEY MESSAGE If one word is unclear, ask now or look it up in the glossary.

Session 5 recap

Three messages to take home.

Design the data

  • Clear CRF items
  • Data dictionary first
  • Checks at entry

Keep it clean

  • Never edit raw data
  • Log every correction
  • Backups, coded IDs

Describe honestly

  • Shape decides the summary
  • Show every patient
  • Table 1 that stands alone

KEY MESSAGE Good analysis starts with good data, described honestly.

Wrap-up and homework

DISCUSSION · 5 min

  • Key words and recap (previous two slides)
  • Exit question in the chat: one data-quality problem found in FLUID-ICU, and how it was fixed
  • Homework: finish Part 3 (first half) of your own proposal
  • Choose one question (Q1 to Q5) for your manuscript and read its results pack before Session 6

Next Saturday: Session 6

  • Confidence intervals, p-values
  • Choosing a test
  • Regression and survival
  • Missing data
  • The five FLUID-ICU questions

OUTPUT Exit answer in the chat (or a one-question form)

Extra slides: Session 5

Extra slides: use if time allows, or for self-study.

Not needed to follow Session 6

Extra: Coding, versions, backups and data sharing

Four habits that protect your data and your future paper.

Coding

  • Codes, not free text
  • Study ID, not names
  • Codes in the dictionary

Versions

  • Raw file: read-only
  • Dated copies, e.g. data_2026-03-12_v2

Backups

  • 3 copies on 2 media
  • 1 copy off-site, encrypted
  • Test a restore

Data sharing

  • Journals ask for a data-sharing statement
  • Plan it at the start

KEY MESSAGE Never edit the raw file: keep it, copy it, date it, back it up.

Extra: Three more chart crimes, and how to fix them
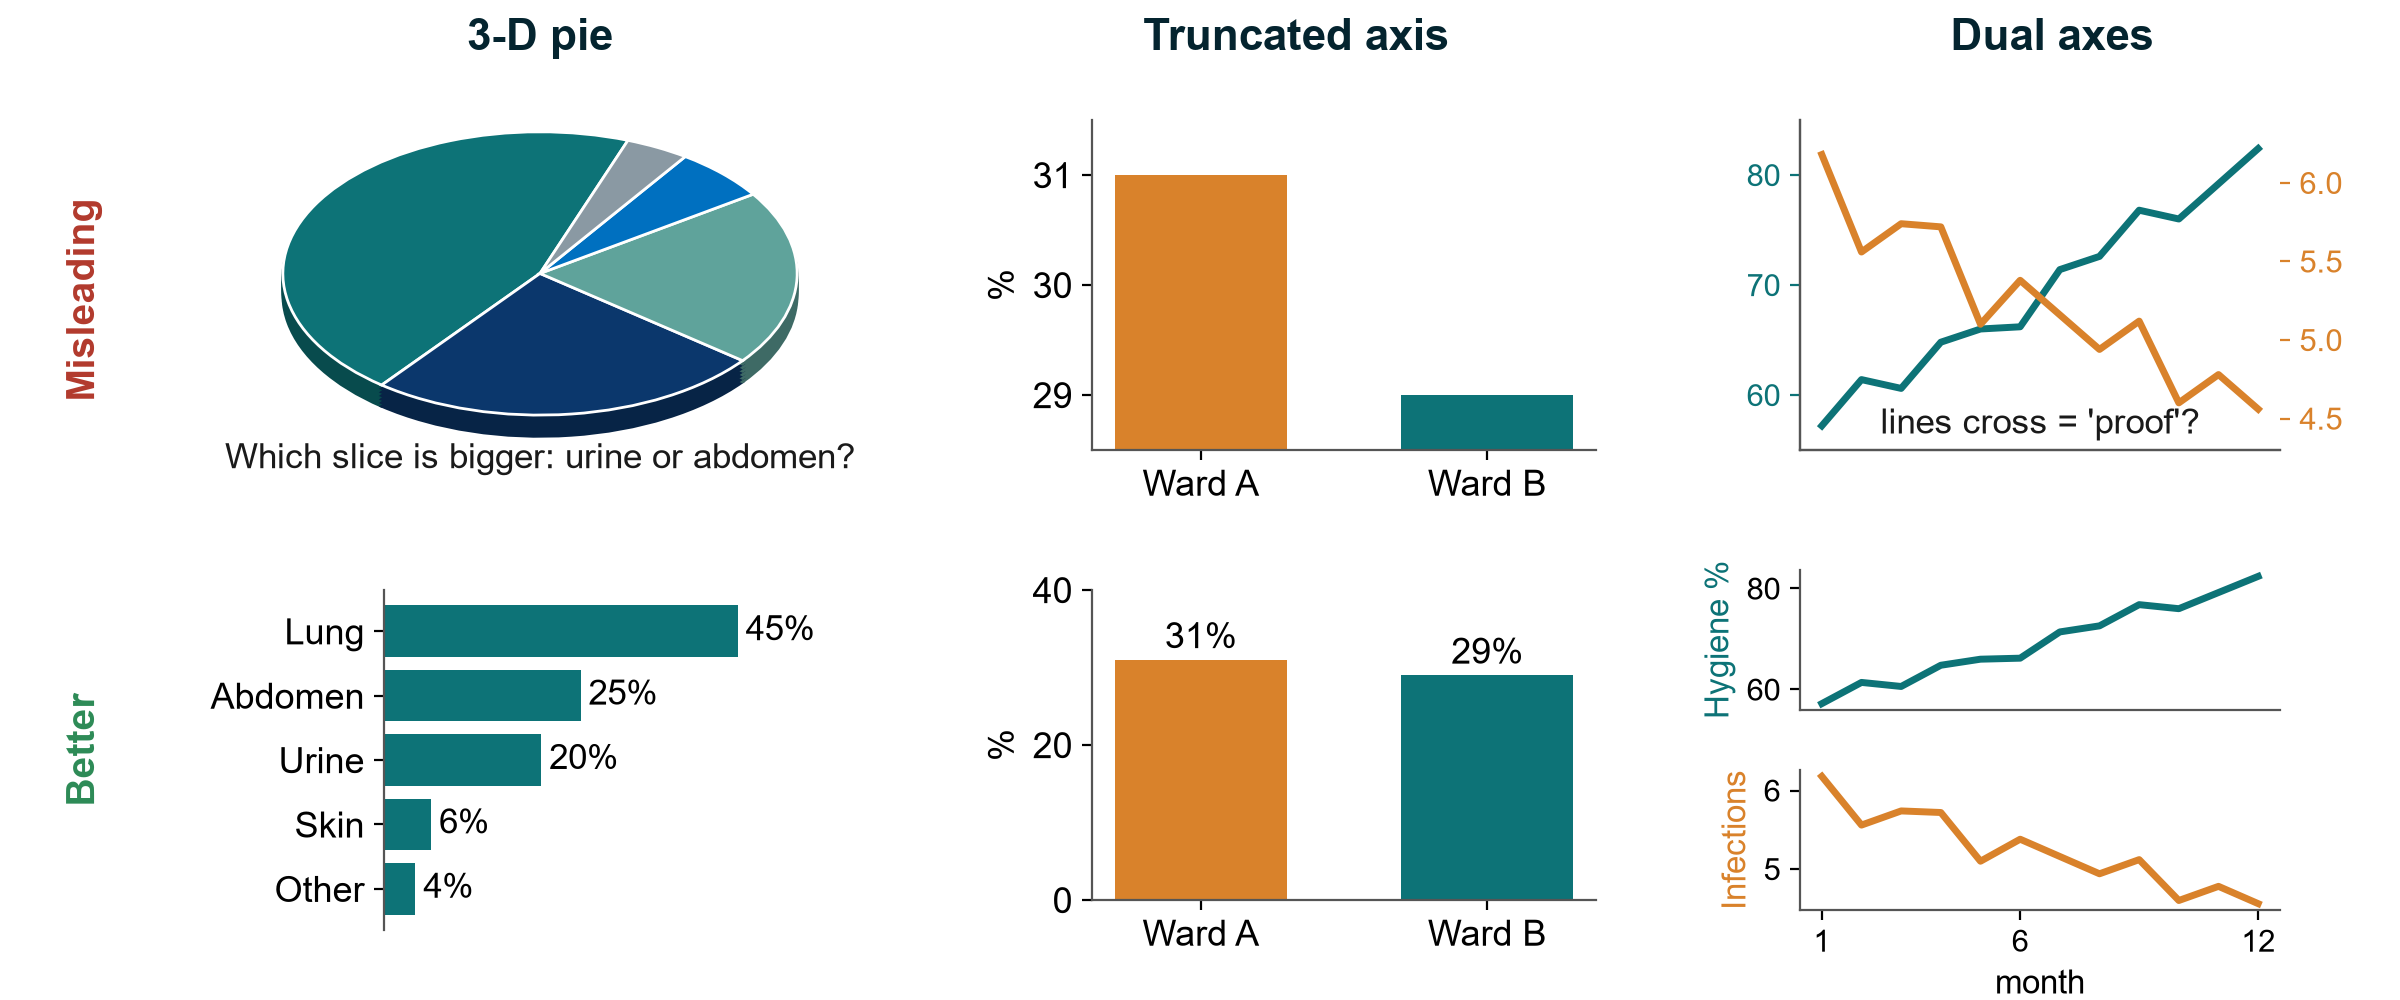
KEY MESSAGE Bars start at zero, one axis per graph, and no 3-D effects.