Session 4 · Bias & effect: can we trust it, how big is it?

Foundations of Clinical Research: From Clinical Question to Publication

Vương Mỹ Lượng & Bernard Osang’ir

Neudata Consulting Ltd

Session 4 · Bias & effect: can we trust it, how big is it?

Part 1

Week 4 · Saturday · online, 19:30-22:30

  • Recap quiz on Session 3 (10 min)
  • 4.1 Bias, confounding and causation (40 min)
  • 4.2 Measuring disease and association, with a live 2x2 demo (25 min)
  • Break (15 min), then two 2x2 calculations together (15 min)
  • 4.3 Beyond single studies: tests, meta-analysis, appraisal (30 min)
  • Proposal builder 4: exposure, outcomes, biases (40 min), then wrap-up (5 min)

Recap quiz: three questions on Session 3

QUICK QUIZ · 9 min

  • Q1. Patients with sepsis who died are compared with survivors for the fluid they received on days 1-3. Design?
  • Q2. Which design randomises whole intensive care units (ICUs) instead of patients?
  • Q3. Restrictive vs usual fluids: mortality difference 95% CI -1 to +3 points. Margin +4 points. Result?
  • Then re-read your own Proposal Part 2a (design, setting, population): 3 min

How we run it

  • Answer in the poll
  • Results on screen, then the answer
  • One volunteer explains why

OUTPUT Poll answers, and your Part 2a ready to extend

Key words of the day

Today’s vocabulary. Each word comes with a picture or an example

Can we trust it?

  • Bias, confounding
  • Effect modification
  • Reverse causation

How big is it?

  • Risk ratio (RR), odds ratio (OR)
  • Risk difference (RD)
  • Number needed to treat (NNT)

Tests

  • Sensitivity, specificity
  • Positive and negative predictive values
  • ROC curve and the area under it

Many studies

  • Forest plot, heterogeneity
  • Risk-of-bias tools

KEY MESSAGE Trust first, then size: a precise answer can still be a biased one.

4.1 Bias, confounding and causation

Bias is systematic error. Size does not fix it.

Selection, information, confounding, effect modification, and from association to causation. (40 minutes)

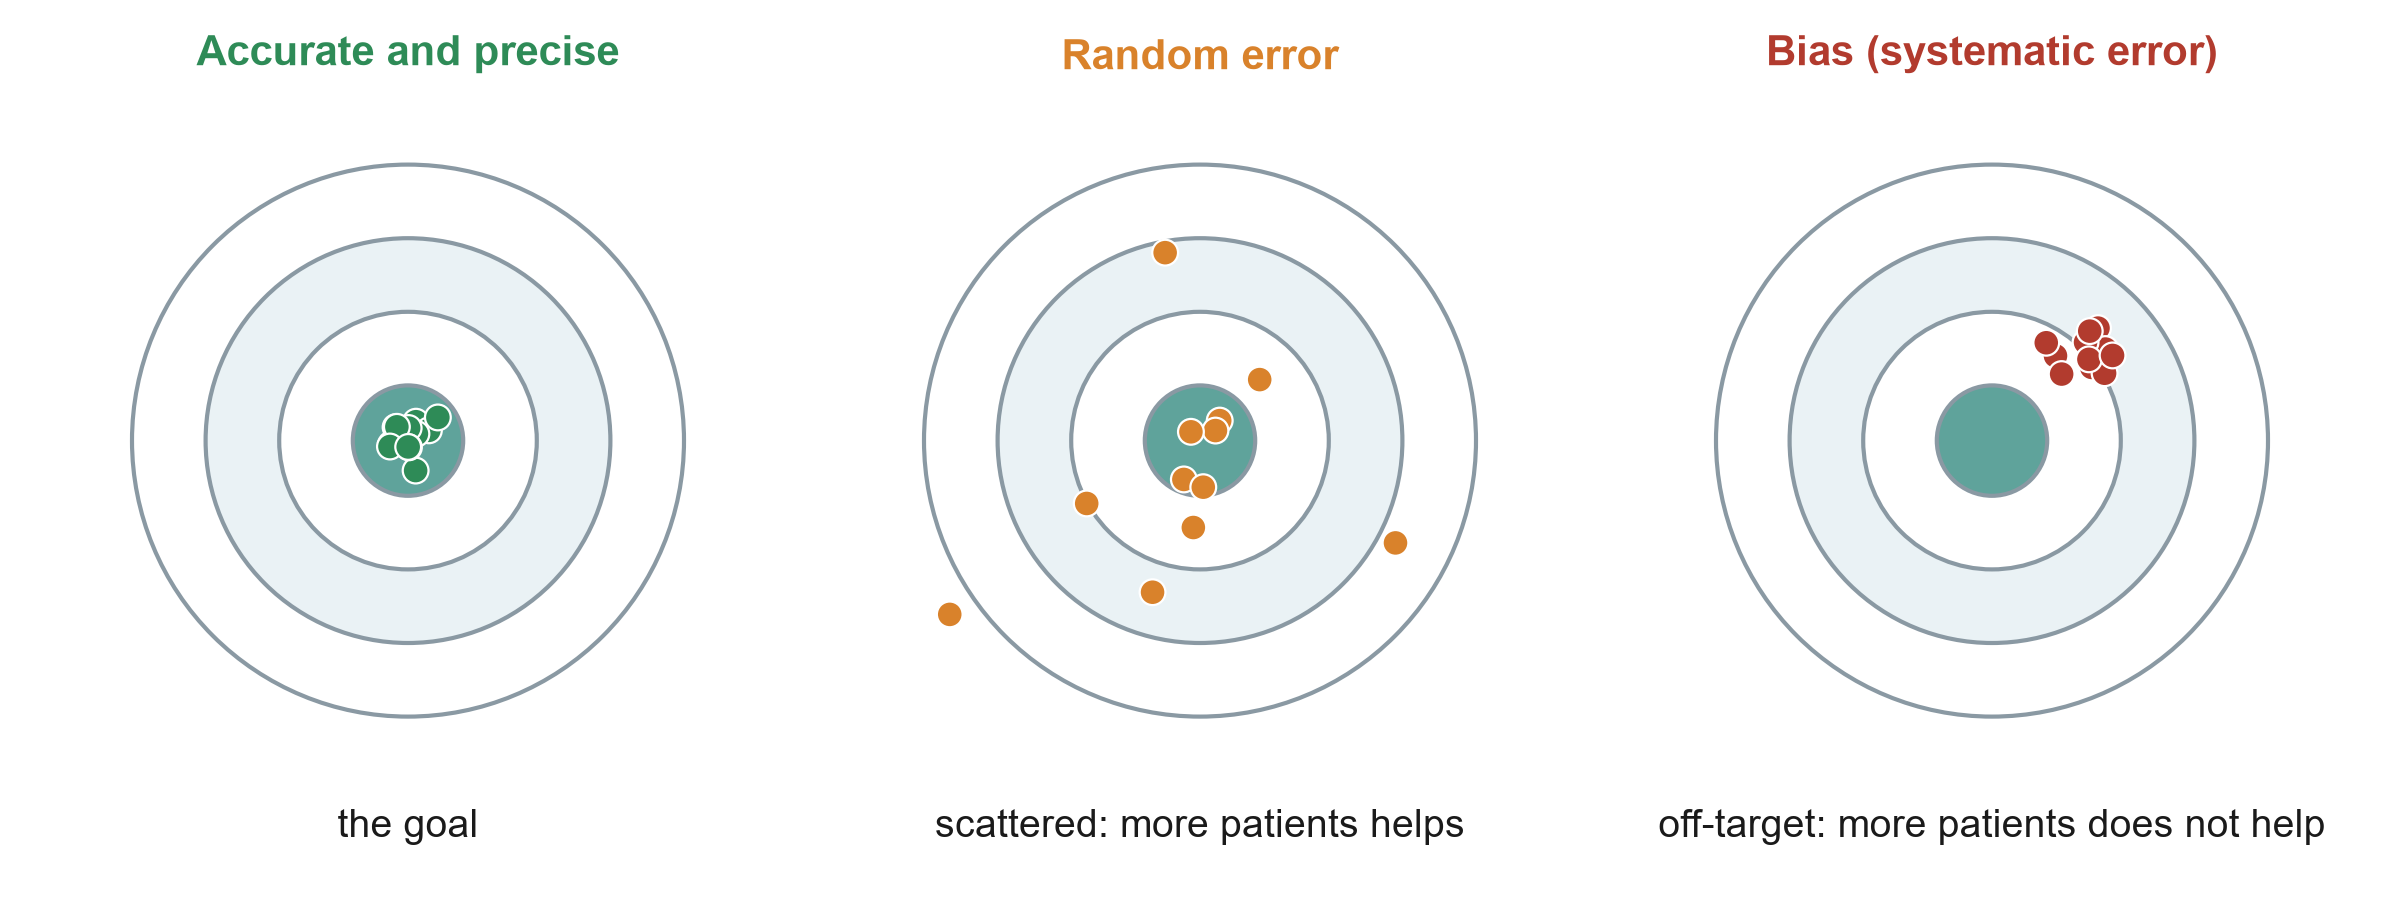
Random error versus bias

KEY MESSAGE A bigger sample shrinks random error but leaves bias untouched.

Selection bias: who got into the study?
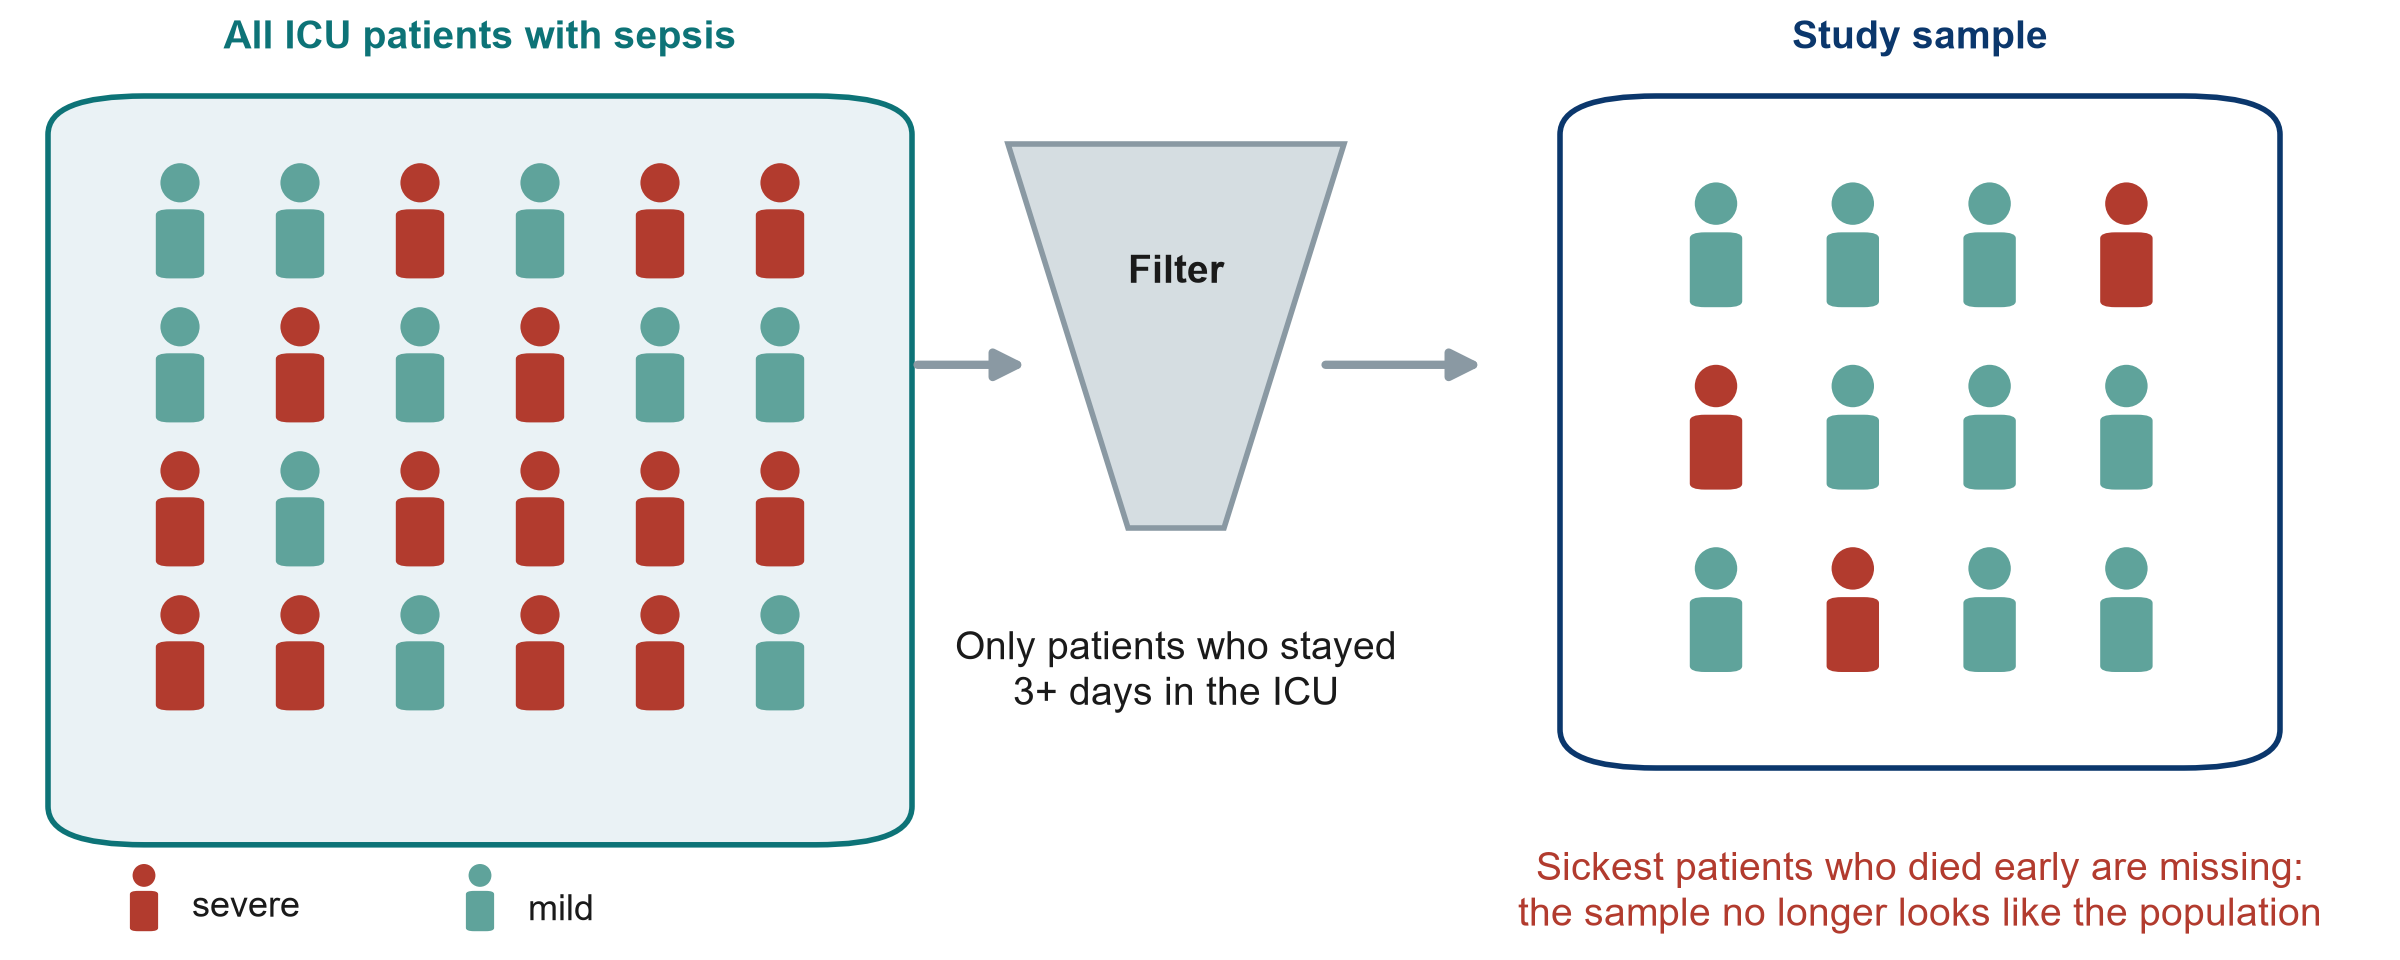
KEY MESSAGE If the sample differs from the target population, results may not transfer.

Information bias: how things were measured

Recall bias

  • Cases search their memory harder than controls
  • e.g. families of patients who died recall the days before admission in more detail
  • Fix: use records made before the outcome

Observer bias

  • An assessor who knows the group judges differently
  • e.g. ‘ready for ICU discharge’ in an unblinded fluid trial
  • Fix: blinded assessor, objective outcome

Measurement bias

  • The tool or the record is wrong in a systematic way
  • e.g. urine output under-recorded on night shifts
  • Fix: standard definitions, checked charts

KEY MESSAGE Measure exposure and outcome the same way in every group.

Confounding by indication: the ICU fluid example
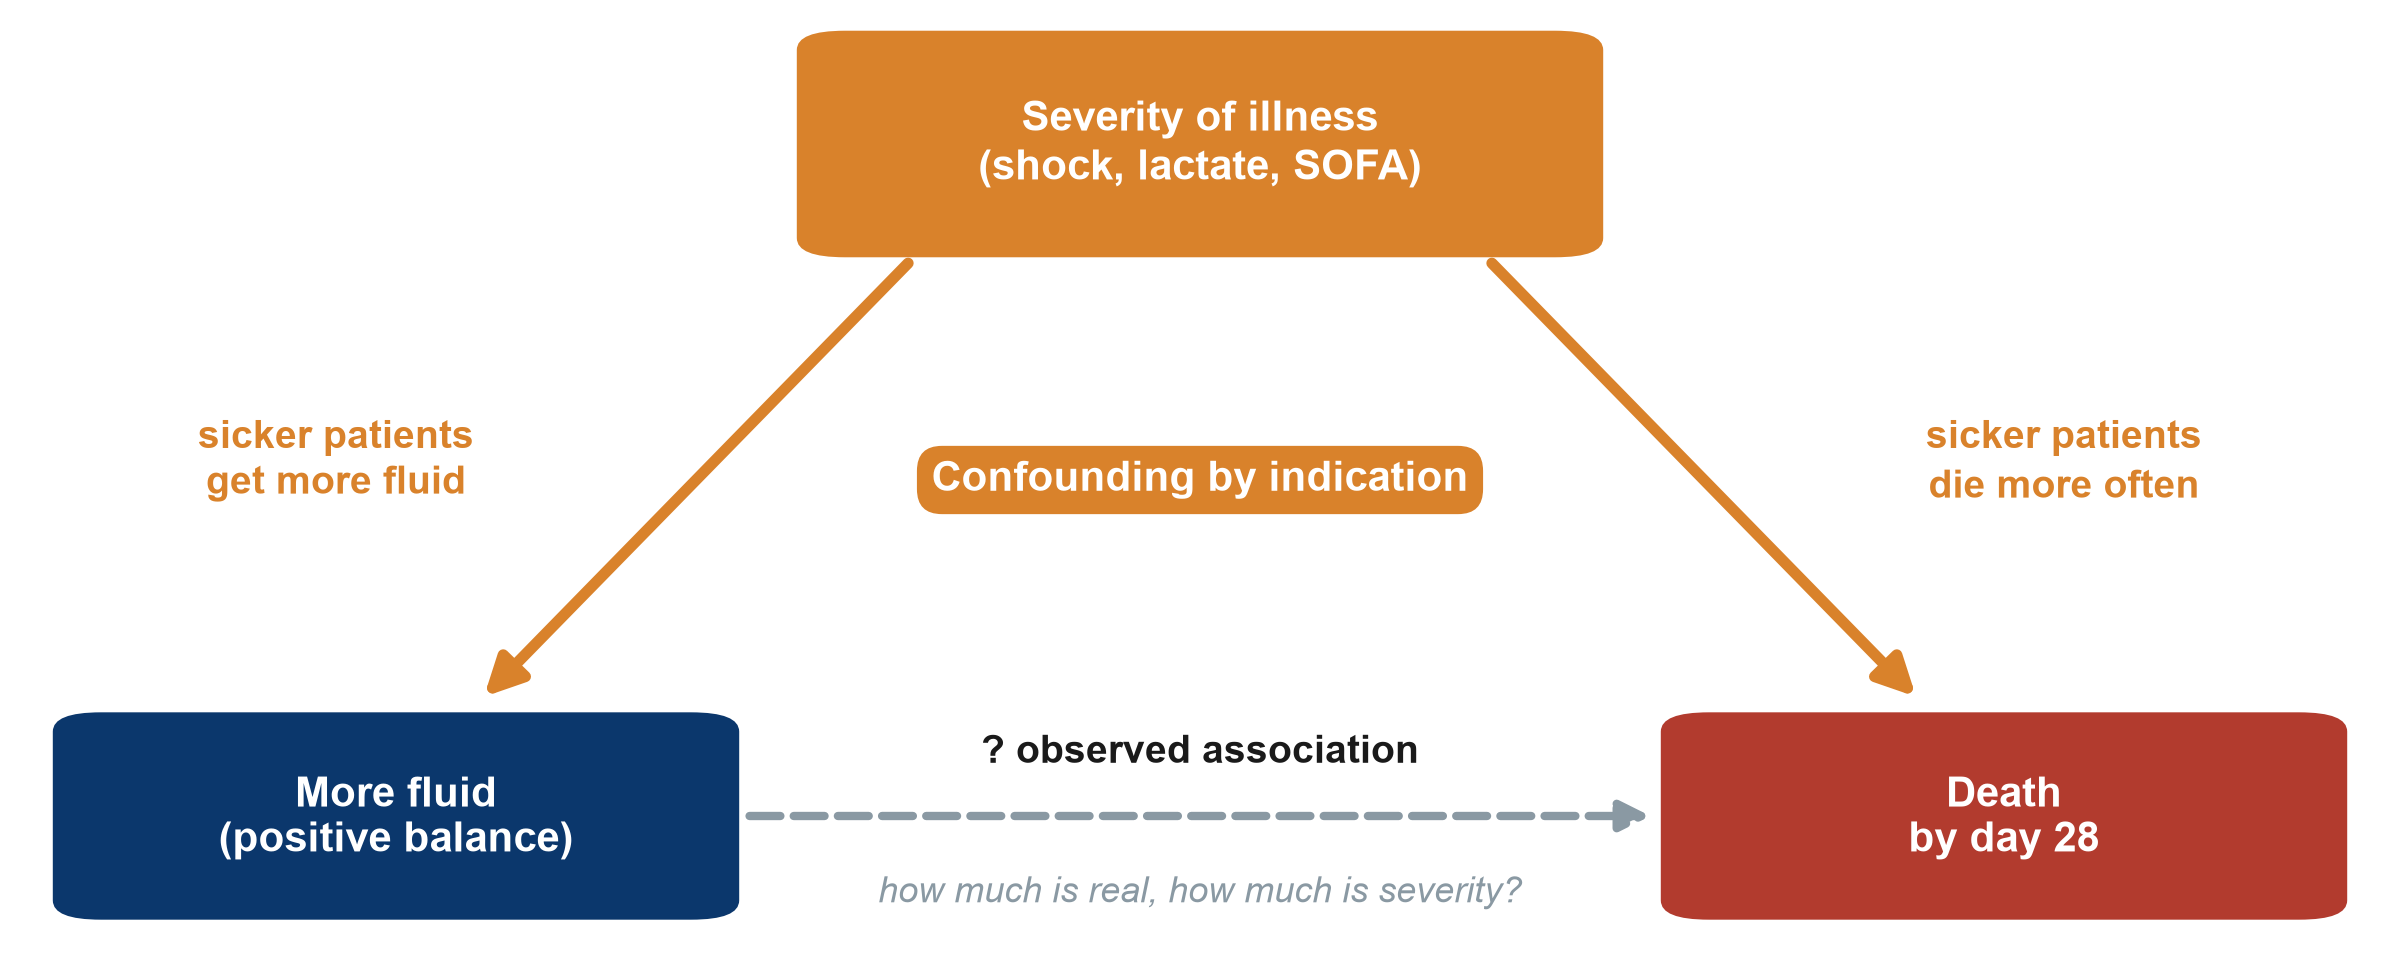
SOFA: Sequential Organ Failure Assessment score

KEY MESSAGE A confounder is linked to the exposure and causes the outcome.

Confounding in numbers: the association disappears
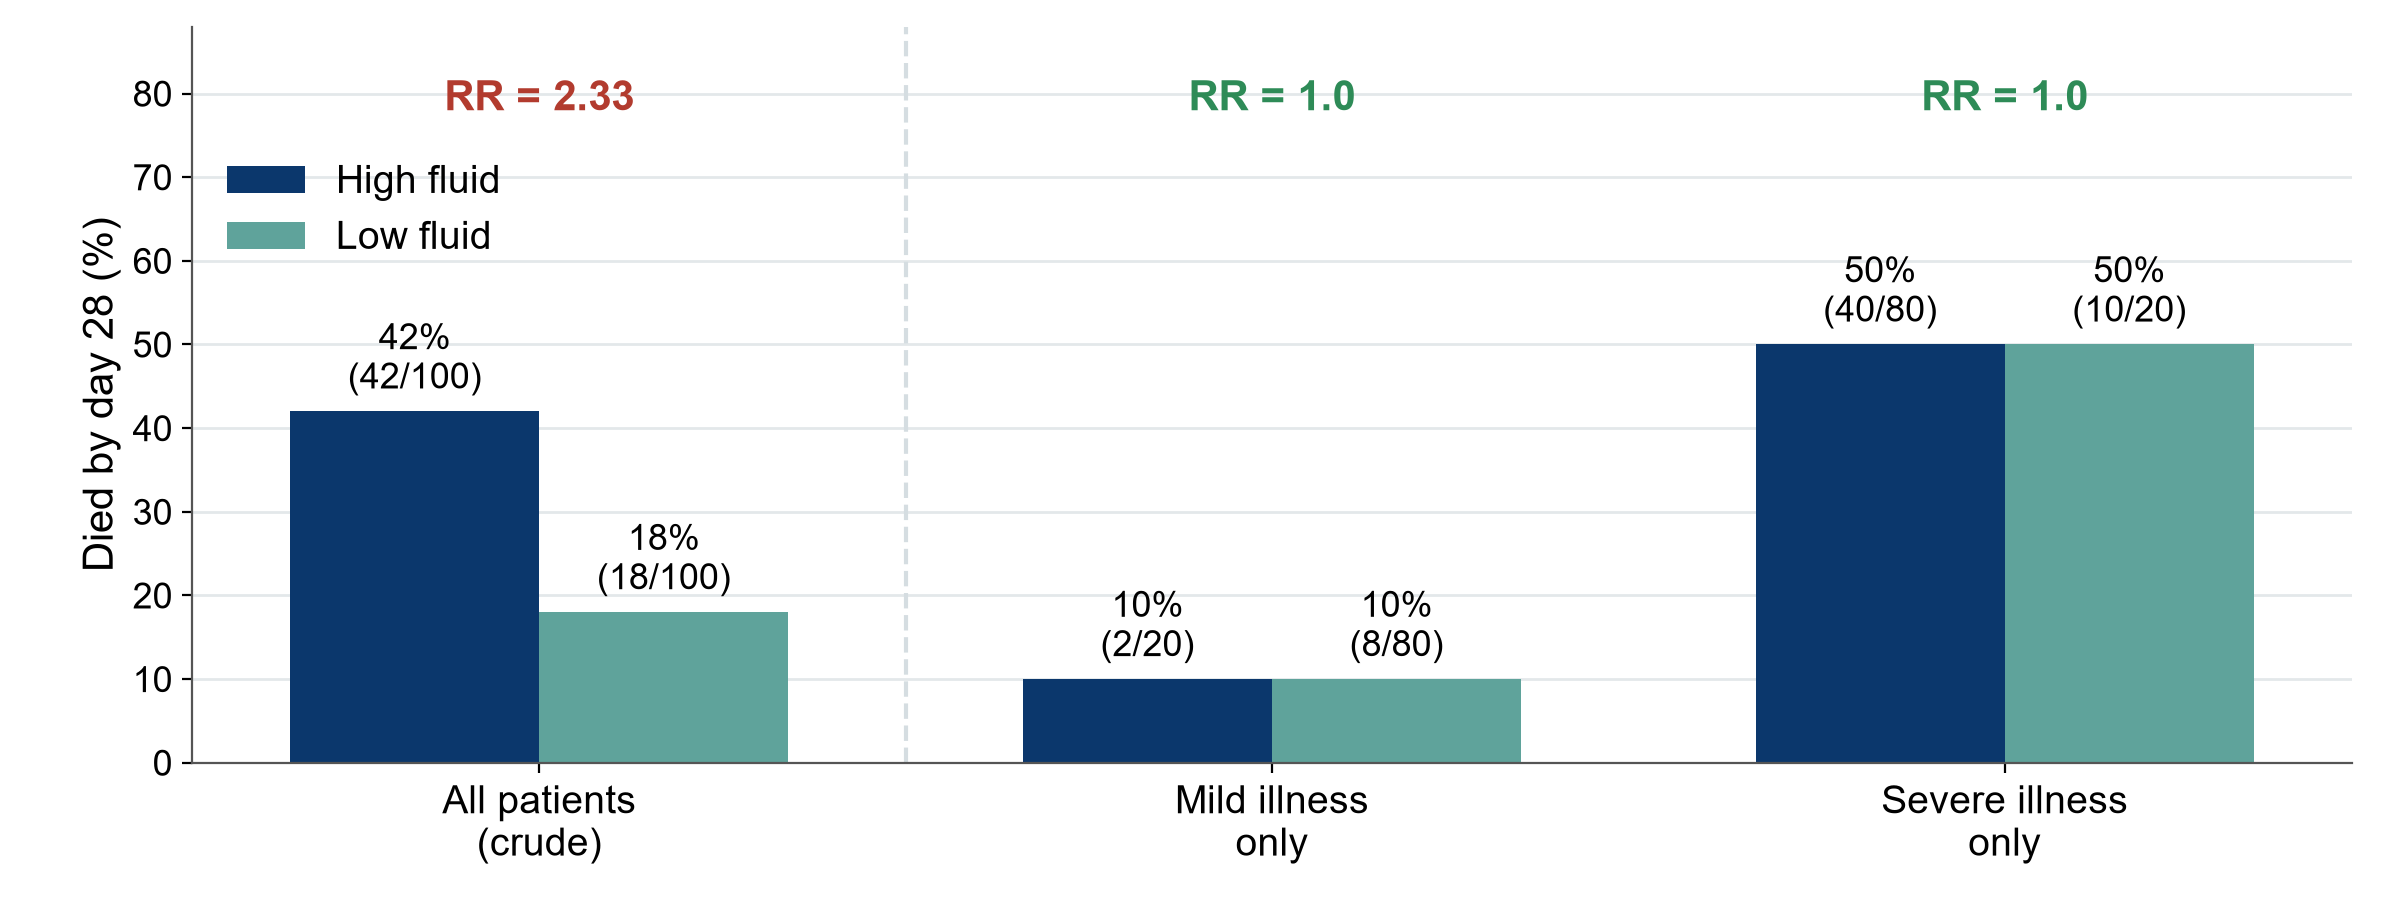
Hypothetical data for teaching. RR: risk ratio.

KEY MESSAGE Compare like with like: within each severity level, fluid makes no difference.

Confounding or effect modification?
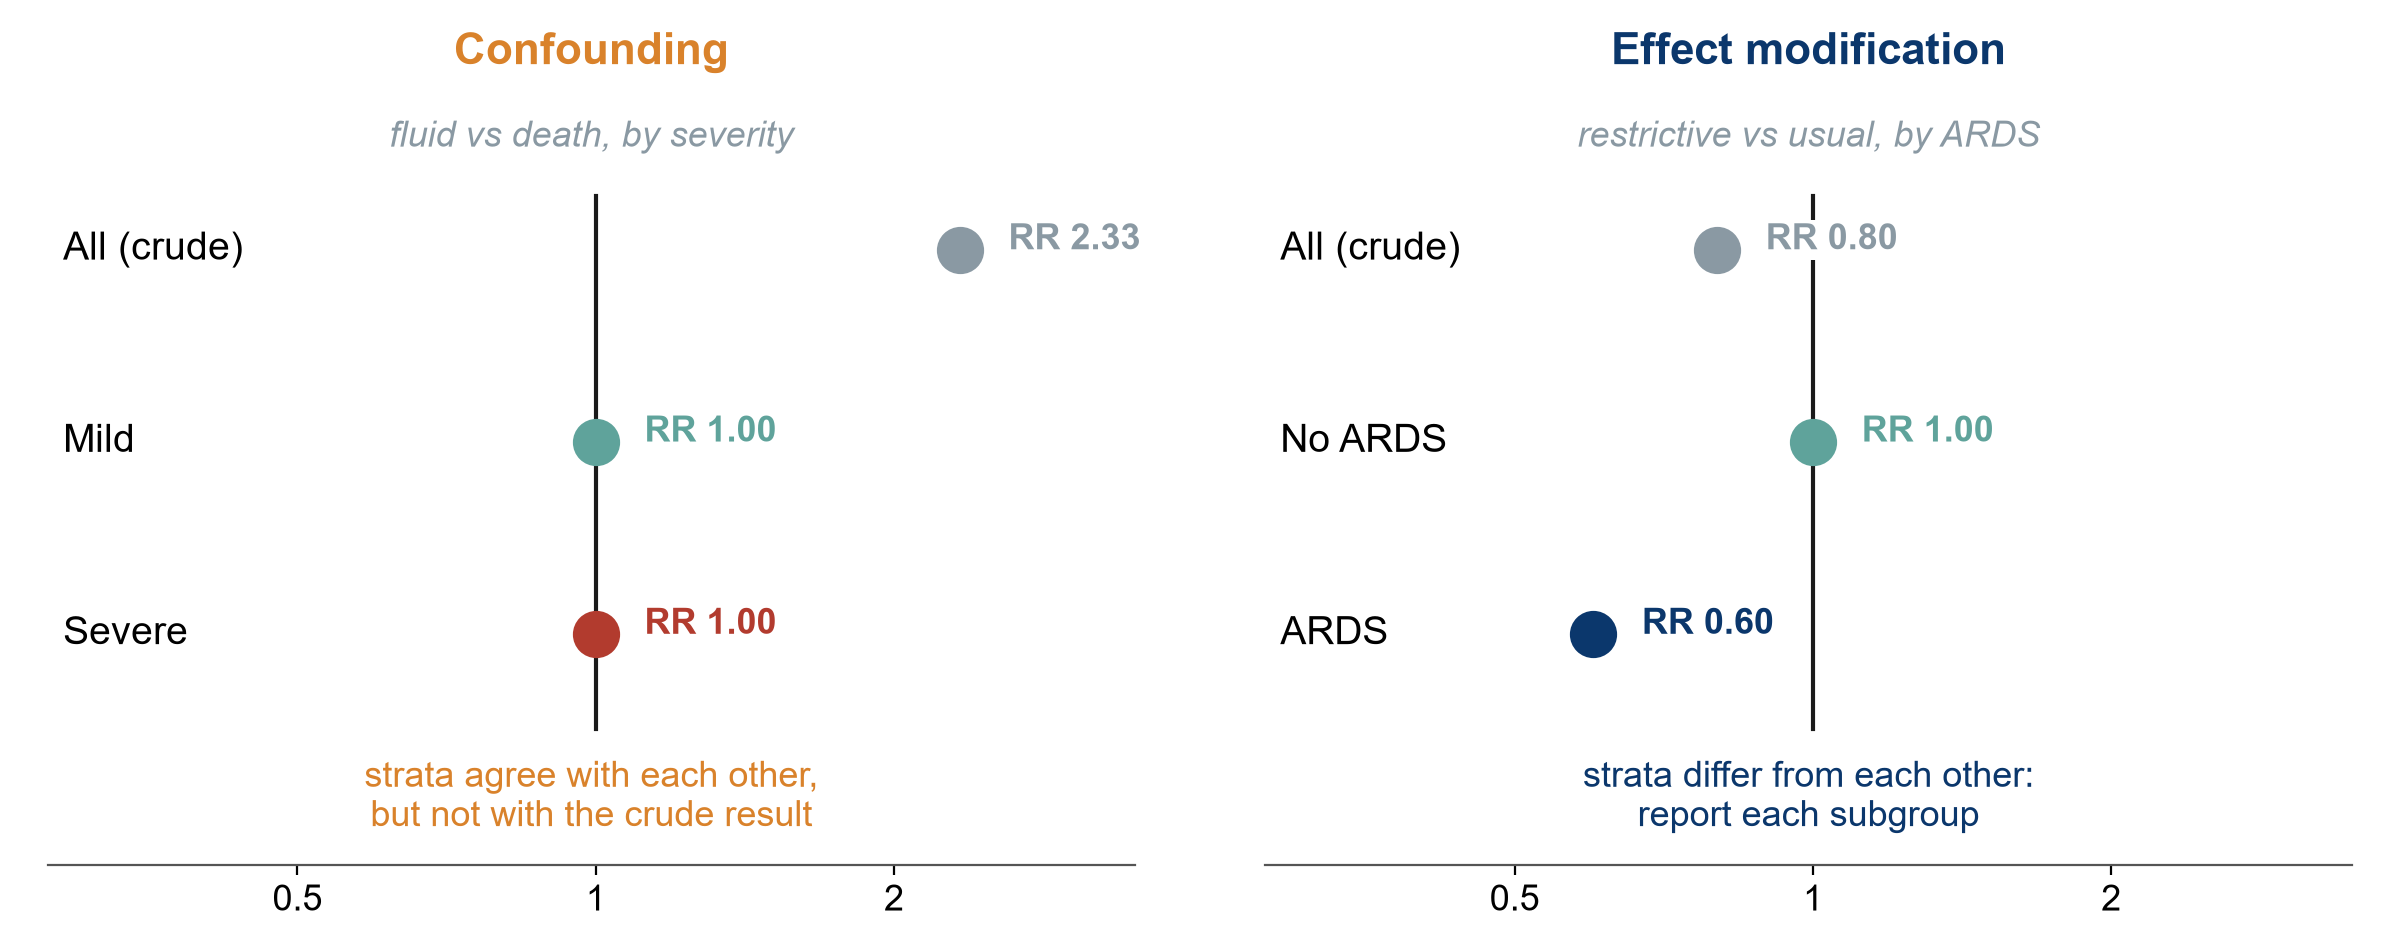
Hypothetical data for teaching. RR: risk ratio. ARDS: acute respiratory distress syndrome.

KEY MESSAGE Confounding is a bias to remove. Effect modification is a finding to report.

How designs fight bias

Build the protection into the design. Repair what is left in the analysis

Randomise and conceal

  • Chance decides the group
  • Balances known and unknown confounders
  • Nobody can predict the next allocation

Blind

  • Patients, clinicians, assessors, analysts
  • Protects how outcomes are measured
  • If impossible: blind the assessor

Restrict, match, adjust

  • Restrict: narrow eligibility
  • Match: pair similar patients
  • Adjust: statistics in the analysis
  • Measured confounders only

KEY MESSAGE Only randomisation protects against confounders you never measured.

Randomisation balances what we know and what we do not
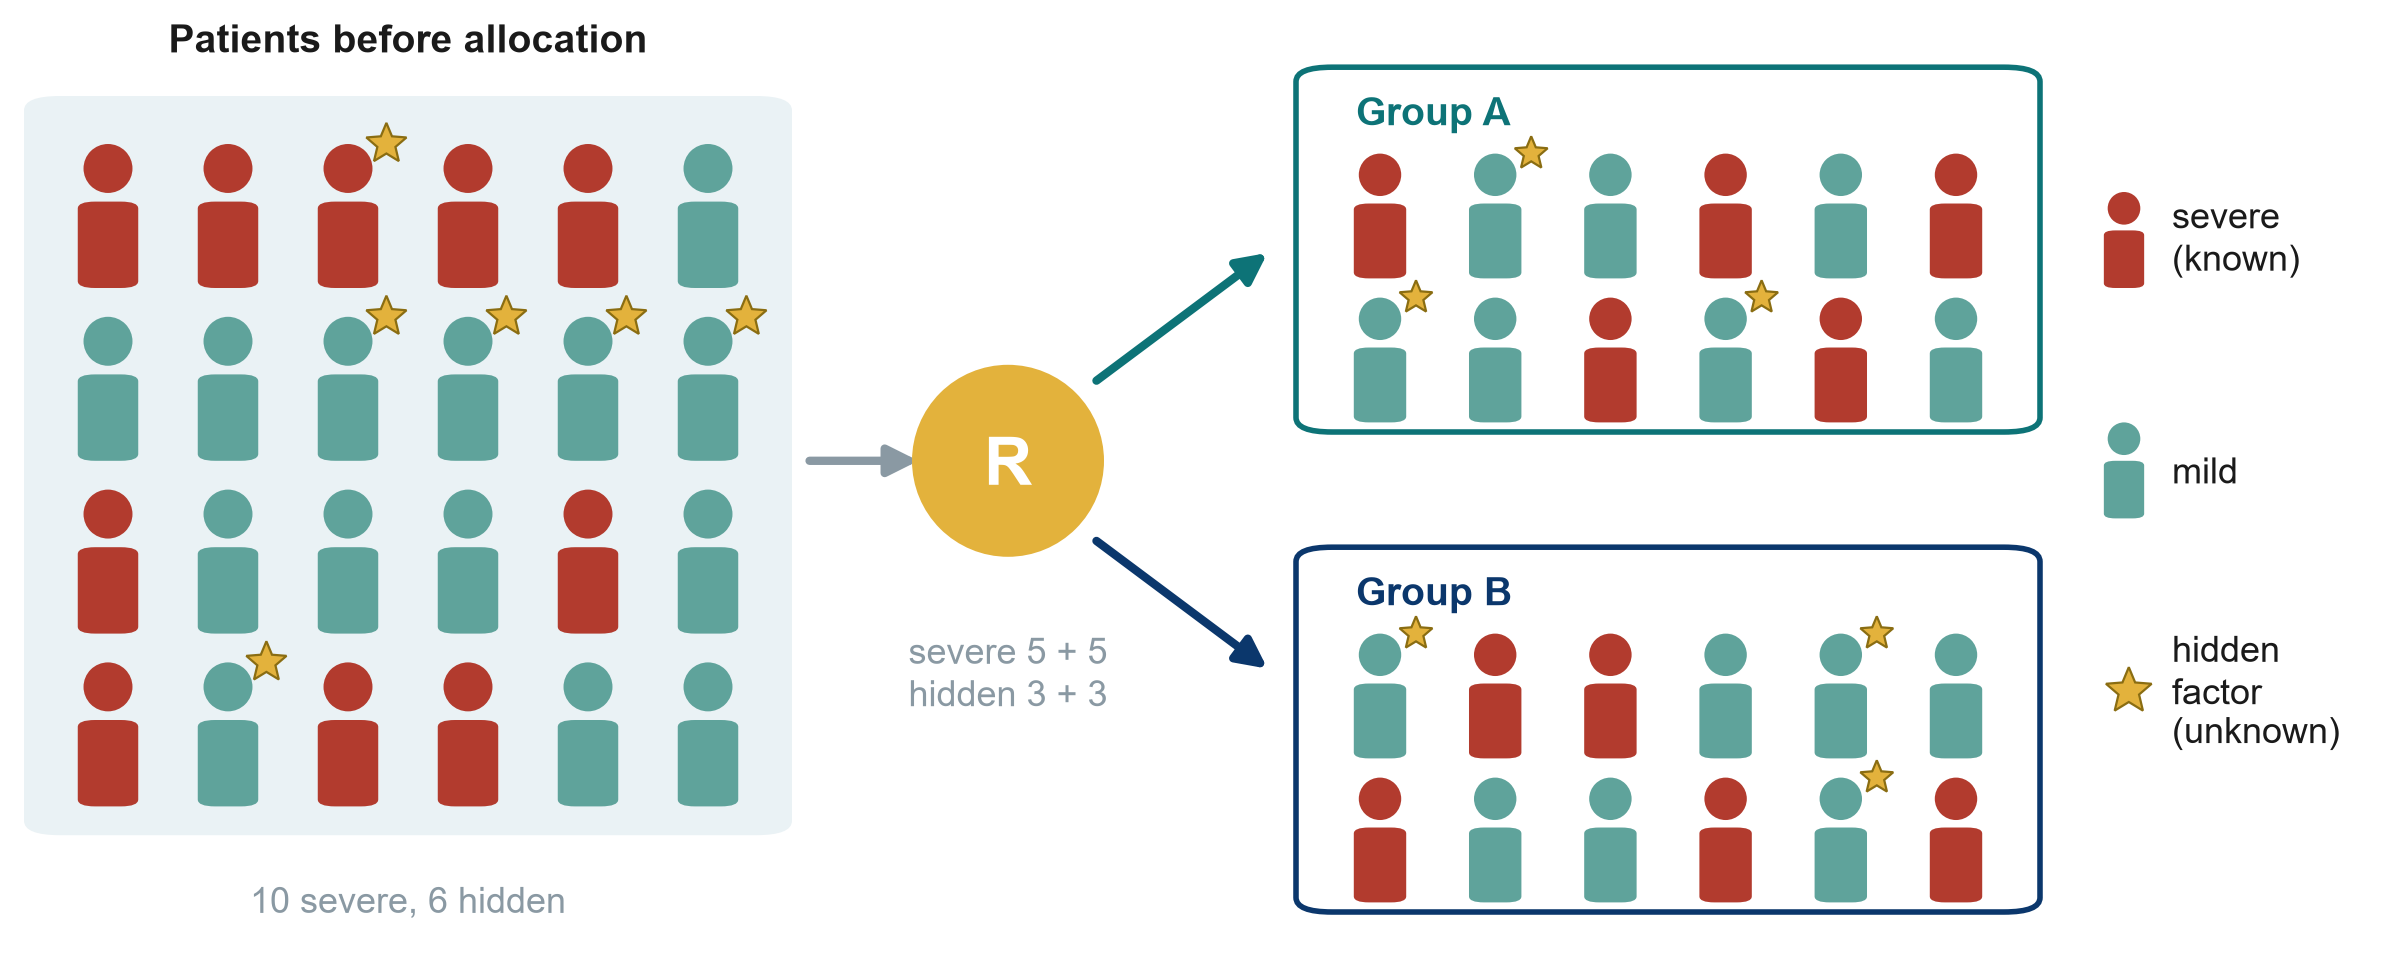
R: randomisation

KEY MESSAGE By chance, both groups get a similar mix, even of factors nobody measured.

Concealment before, blinding after

Before: allocation concealment

  • Nobody can predict the next allocation
  • Paper 1 (Boulet): a central computer
  • Protects who gets into each group
  • Always possible, always required

After: blinding in Paper 1 (Boulet 2024)

  • Patients: blinded
  • Clinicians: knew the group
  • Outcome assessors: knew the group
  • Statisticians: blinded

KEY MESSAGE Concealment protects who gets in. Blinding protects how outcomes are measured.

Matching helps, but only for what was measured

Paper 2 (Hyun 2023). SOFA: Sequential Organ Failure Assessment score

1:1 matching

  • Each positive-balance patient paired with a similar negative-balance patient
  • 483, 373 and 392 pairs for days 1, 2 and 3

Measured: balanced

  • Age, sex, SOFA score, septic shock
  • Comorbidities, infection site
  • Fluid output

Not measured: may still differ

  • Type of fluid, nutrition
  • The clinician’s bedside judgement
  • This is residual confounding

KEY MESSAGE Matching and adjustment cannot balance what nobody recorded.

Internal validity first, then external validity

Internal validity

  • Is the answer right for the people studied?
  • Randomisation
  • Concealment and blinding
  • Complete follow-up
  • Good measurement

External validity

  • Does it apply to my patients?
  • Boulet: age 18-85. My ICU: many over 85?
  • Boulet: no dialysis. My ICU: patients on dialysis?
  • Boulet: 3 ICUs in one country
  • Boulet: only 4% of screened patients enrolled

KEY MESSAGE First: is it right for the people studied? Then: does it apply to mine?

Reverse causation: which came first?

What we assume

  • A positive fluid balance harms the kidneys
  • Kidney injury then leads to death

What may really happen

  • Failing kidneys make less urine
  • Less urine out makes the balance positive
  • The arrow runs the other way

How to check

  • Which came first?
  • Measure the exposure before the outcome starts
  • Use a time lag
  • Prefer a cohort or an RCT to a cross-sectional study

KEY MESSAGE Before claiming X causes Y, make sure Y did not cause X.

From association to causation: the Bradford Hill viewpoints

Viewpoint What it asks Applied to Paper 2 (Hyun 2023)
Strength Is the effect big? Moderate (HR about 1.6 to 2.1)
Consistency Seen in other studies and places? Yes, in other cohorts
Specificity One cause, one effect? (the weakest) Not useful here
Temporality Did the cause come first? (the only must) Balance before death, but reverse causation is possible
Dose-response More exposure, more effect? Not shown
Plausibility Is there a biological mechanism? Yes: fluid overload, oedema, organ congestion
Coherence Does it fit what we already know? Mostly
Experiment Does removing the exposure reduce the outcome? Trials such as Boulet: no effect on deaths shown yet
Analogy Do similar causes have similar effects? Fluid overload harms in other settings

HR: hazard ratio. Causation is a judgement built from many clues. Temporality is the only must.

Quick quiz: Spot the bias

QUICK QUIZ · 5 min

  • Families of patients who died recall the days before ICU admission in more detail than families of survivors
  • In an unblinded fluid trial, the doctor who knows the group decides when a patient is ‘ready for ICU discharge’
  • A fluid study includes only patients who stayed in the ICU for 3 days or more
  • Patients with a higher lactate get more fluid and die more often

Vote for one

  • Selection bias
  • Recall bias
  • Observer bias
  • Confounding

OUTPUT One bias named for each scenario, and one fix said aloud

4.2 Measuring disease and association

How common? How much more likely?

Prevalence, incidence, risk, and the 2x2 table behind RR, OR, RD and NNT. (25 minutes)

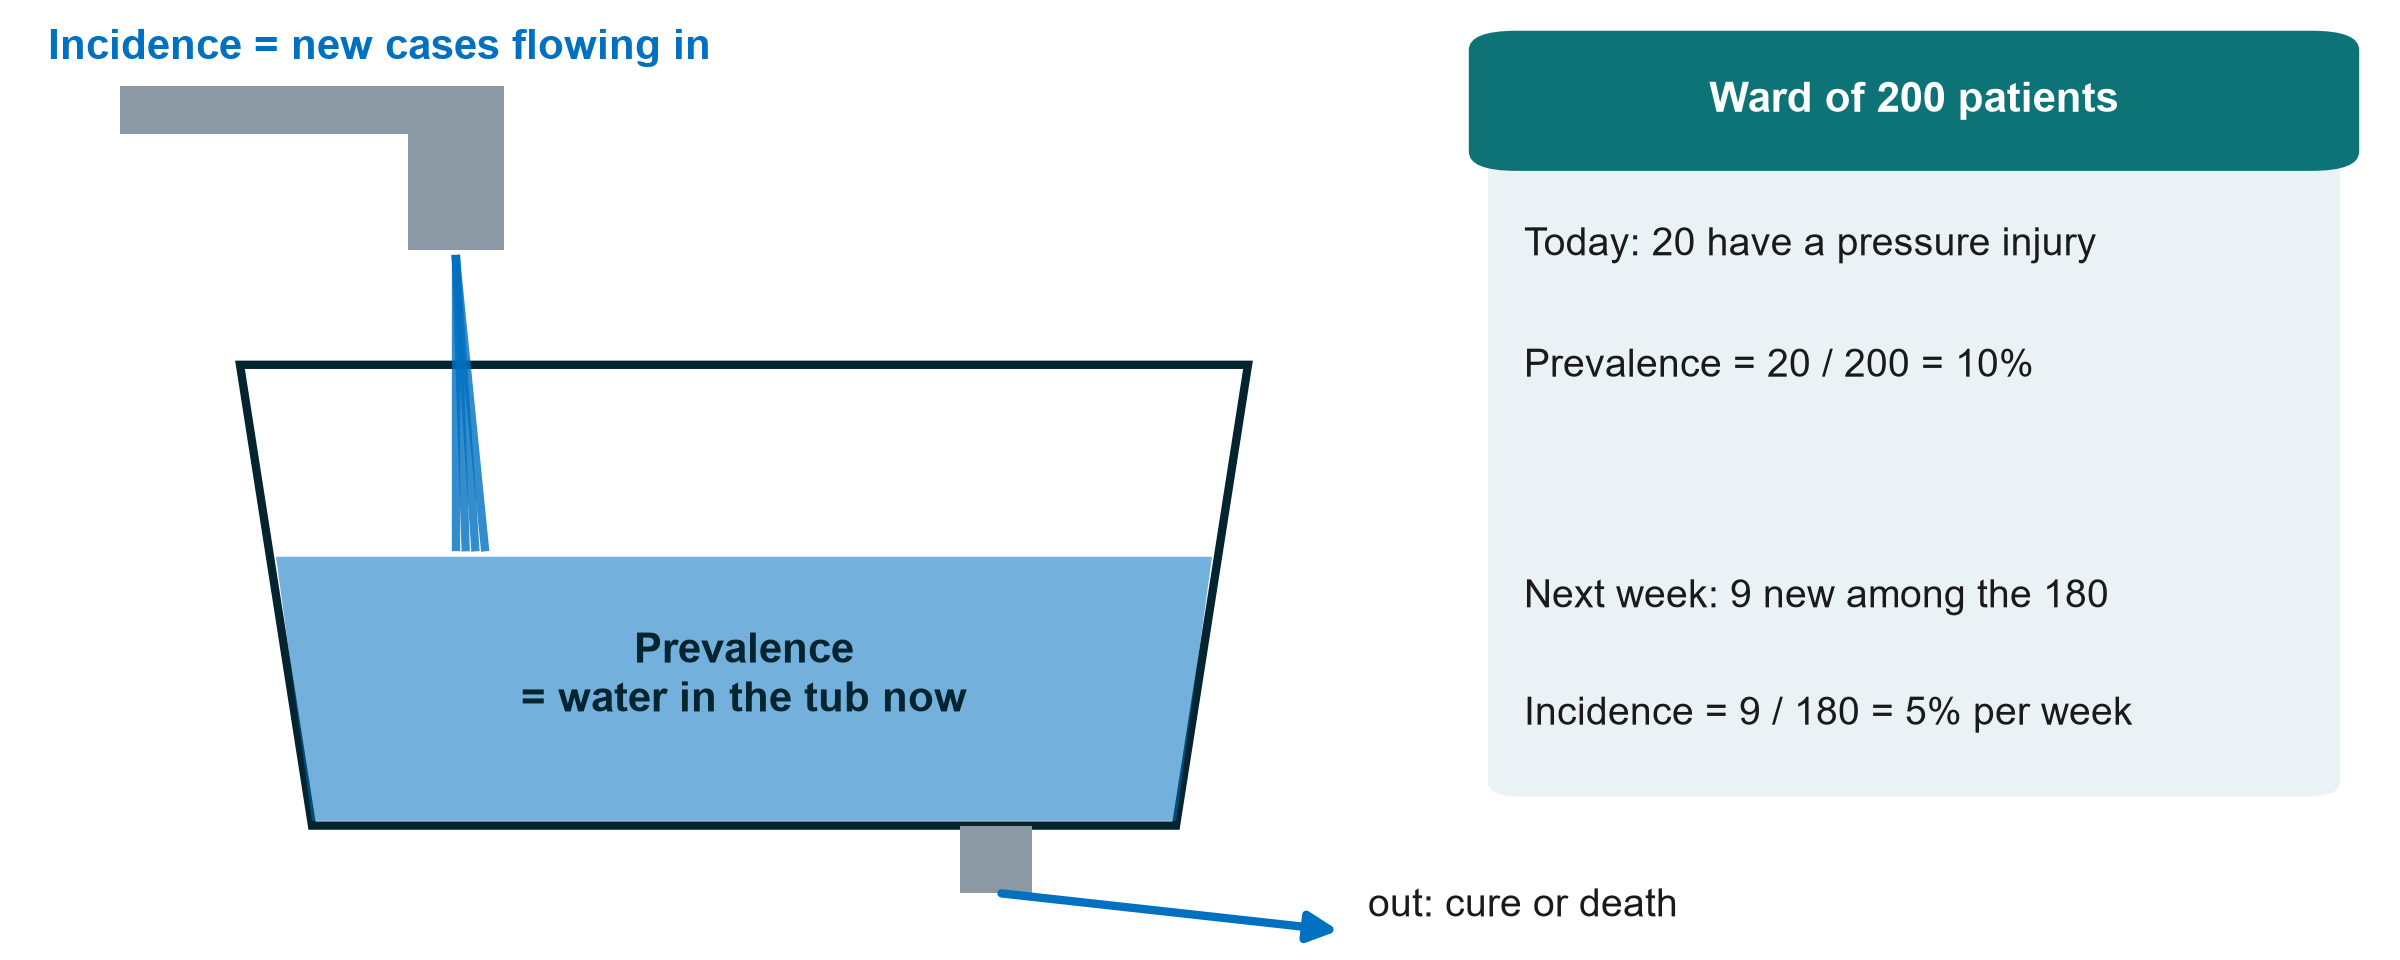
Prevalence and incidence: the bathtub

KEY MESSAGE Prevalence = how many have it now. Incidence = how many new cases over time.

Risk in two groups, as pictures
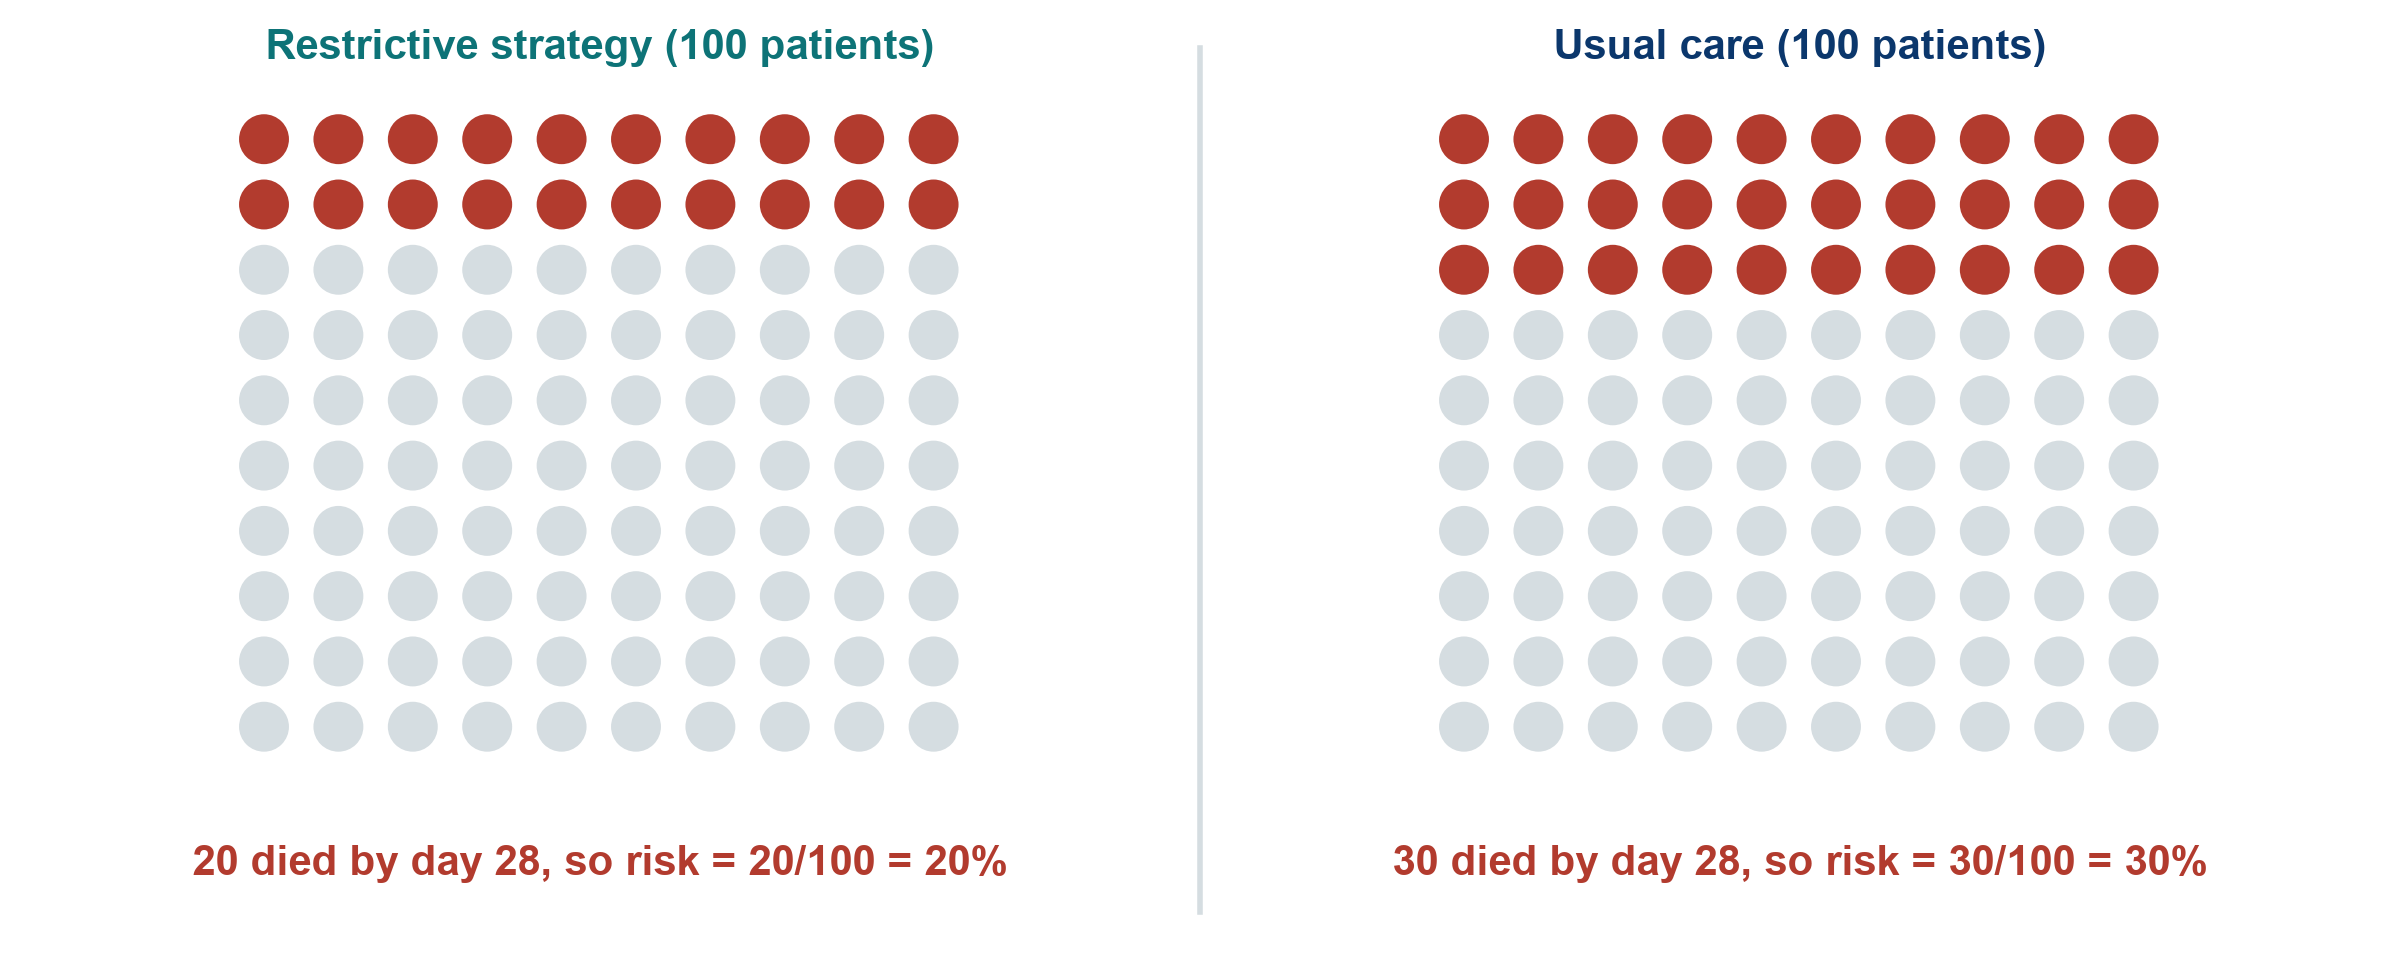
Hypothetical trial for teaching: 100 patients per group

KEY MESSAGE Risk = people with the outcome / people in the group.

The 2x2 table: one tool for every measure

Hypothetical trial Died Survived Total Risk
Restrictive a = 20 b = 80 a + b = 100 a / (a + b) = 20%
Usual care c = 30 d = 70 c + d = 100 c / (c + d) = 30%

Always the same layout: exposure in rows, with the exposed (treated) group on top. Outcome in columns, with ‘outcome yes’ (died) on the left. Then a, b, c and d always mean the same thing.

Four measures from one 2x2 table

Worked example: restrictive 20/100 died, usual care 30/100 died

Risk ratio (RR)

  • [a/(a+b)] / [c/(c+d)]
  • 20% / 30% = 0.67
  • Risk is one third lower

Risk difference (RD)

  • a/(a+b) - c/(c+d)
  • 20% - 30% = -10 points
  • 10 fewer deaths per 100

Number needed to treat (NNT)

  • 1 / |risk difference|
  • 1 / 0.10 = 10
  • Treat 10 to prevent 1 death

Odds ratio (OR)

  • (a x d) / (b x c)
  • (20 x 70) / (80 x 30) = 0.58
  • Odds, not risk

KEY MESSAGE Ratios tell you how strong. Differences tell you how many patients.

NNT (number needed to treat) in pictures
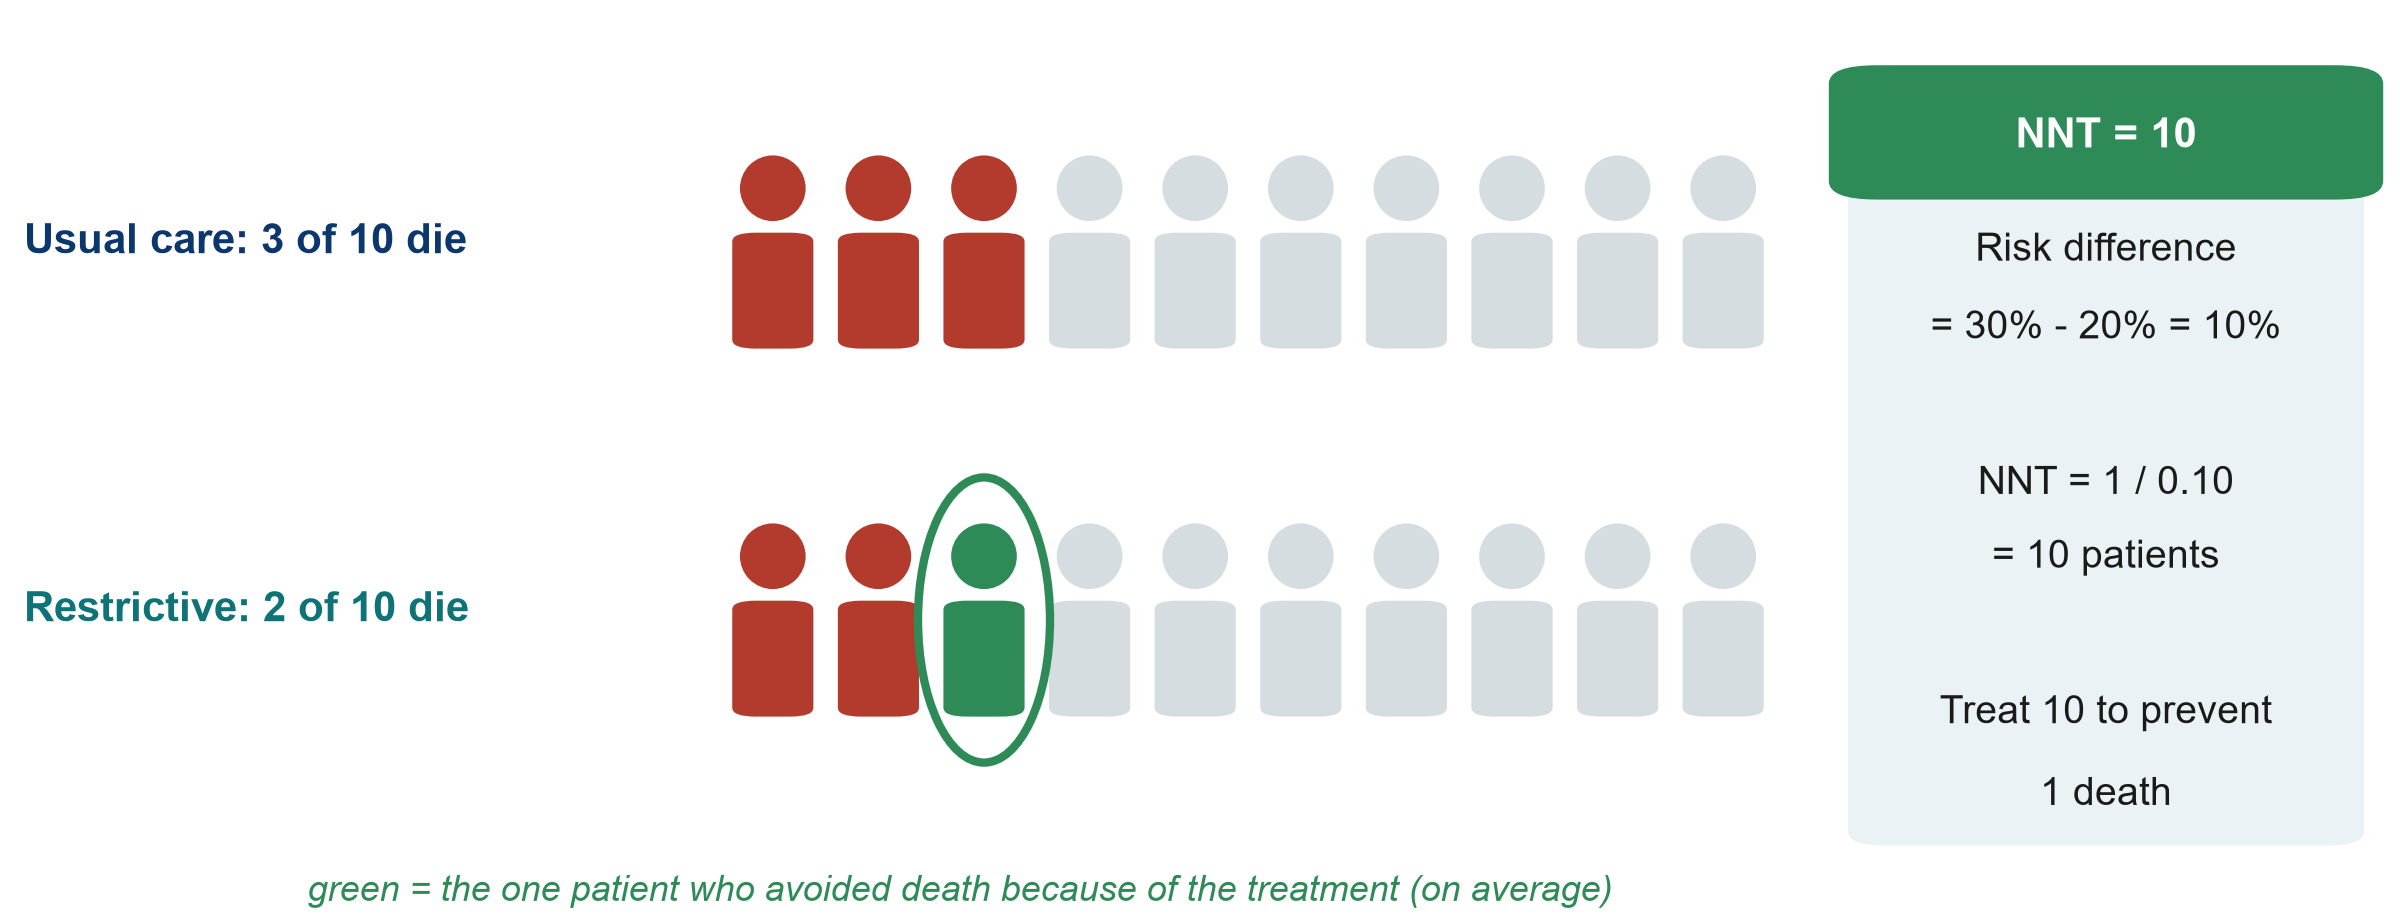
KEY MESSAGE NNT = 1 / risk difference: how many to treat for one to benefit.

When is the odds ratio close to the risk ratio?
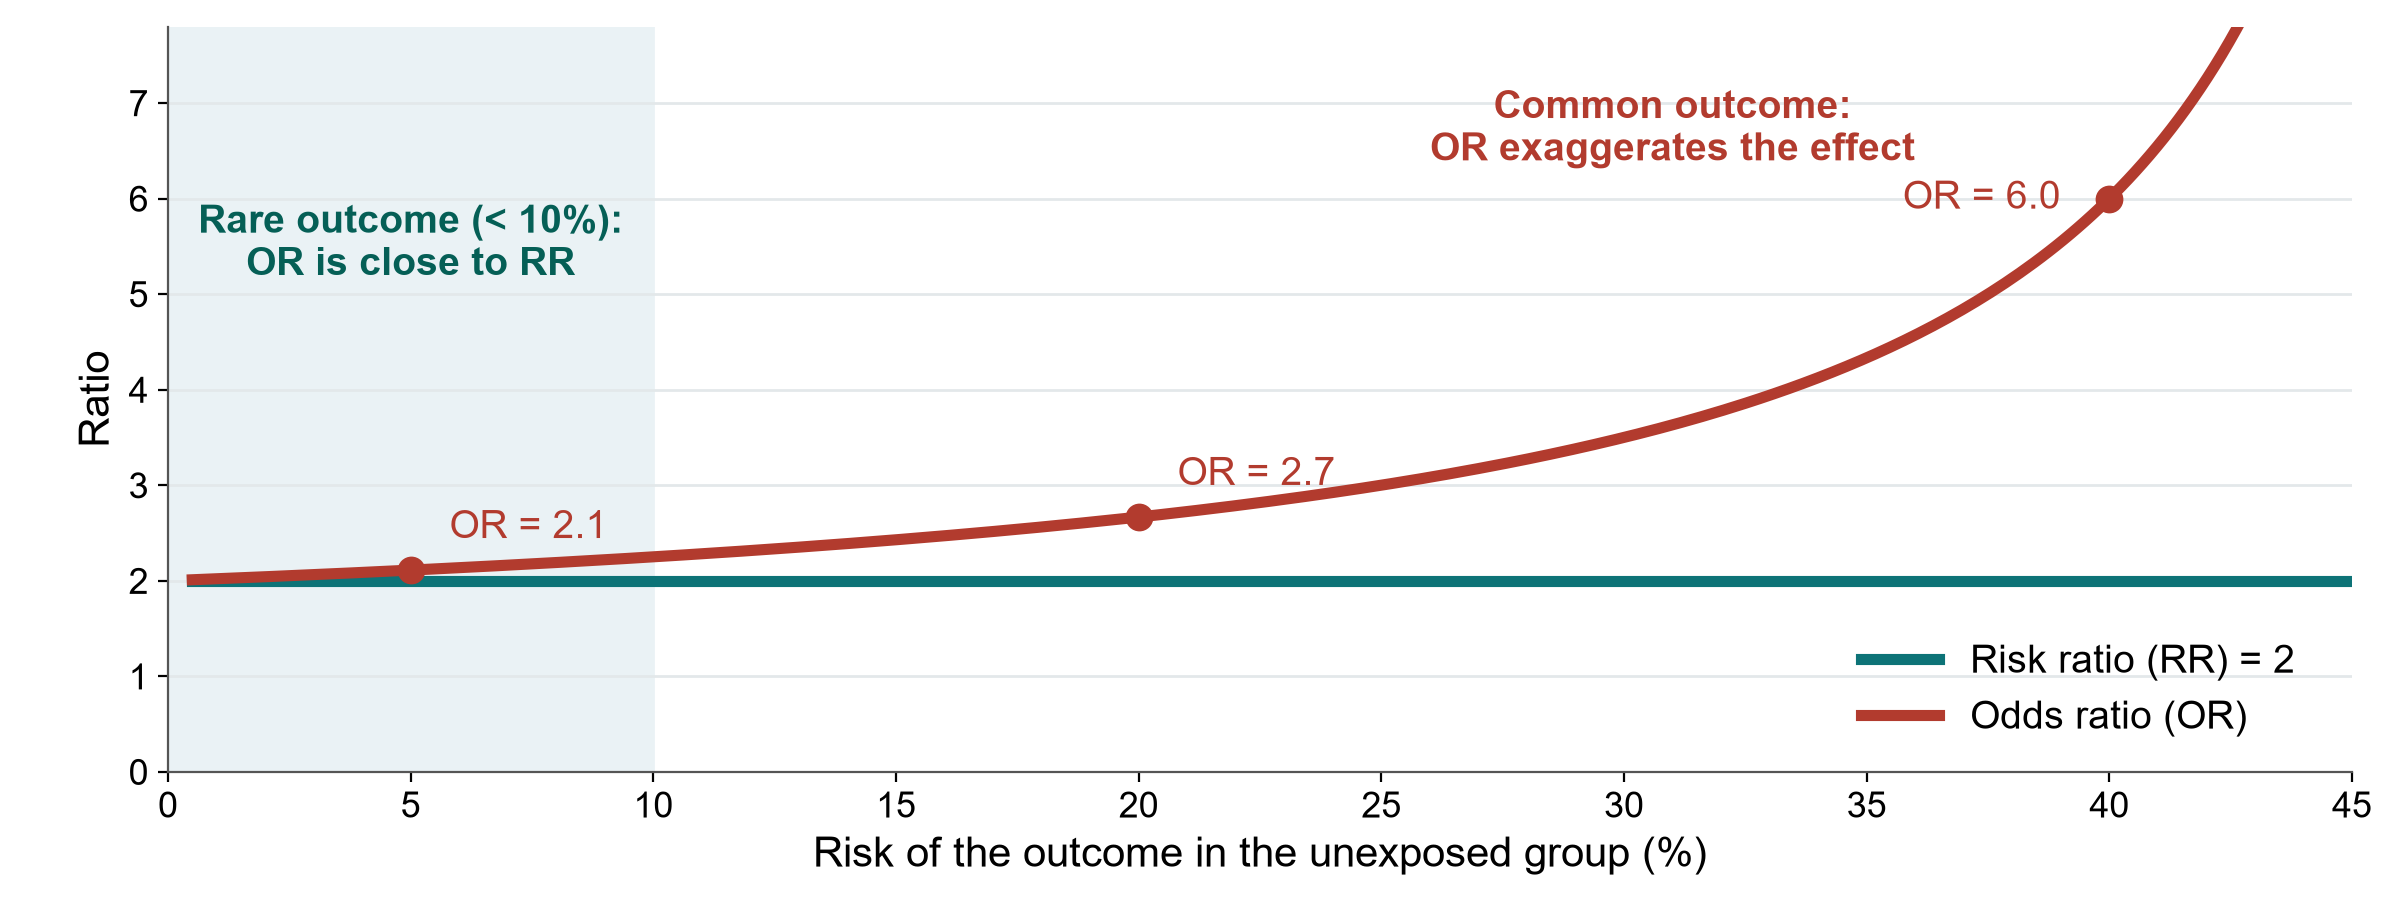
KEY MESSAGE OR is close to RR only when the outcome is rare (under about 10%).

Live demo: the 2x2 calculator

LIVE DEMO · 8 min

  • The instructor shares the screen: Course/Resources/tools/2x2_calculator.xlsx, sheet Association
  • Enter a, b, c, d from the worked example: 20, 80, 30, 70
  • Read the risks, RR, RD, NNT and OR, and the plain-language lines
  • Change the deaths to 2 and 3 of 100: watch the OR approach the RR
  • Point at the red line: case-control data give an OR only

Watch for

  • Same layout as the slide
  • Relative vs absolute effect
  • Rare outcome: OR close to RR

OUTPUT Everyone has seen every measure computed from one table

Break

15 min

Exercise: two 2x2 calculations, together

WHOLE-CLASS TASK · 15 min

  • Session 4 exercise sheet (PDF sent before the session), Part C: draw each 2x2 table first, exposure in rows
  • Calculation 1 (a fluid trial, 200 per group): risks, RR, RD, NNT, OR. Answer each in the poll
  • Calculation 2 (a fluid case-control study): OR only. Poll: can we calculate an RR?
  • The instructor checks each answer live with the 2x2 calculator
  • A volunteer says each result in one plain sentence

Remember

  • Risk = a / (a + b)
  • RR = risk / risk
  • NNT = 1 / risk difference
  • OR = (a x d) / (b x c)

OUTPUT Both calculations solved together, each with one plain sentence

4.3 Beyond single studies

One study is rarely the answer.

Diagnostic tests, systematic reviews and meta-analysis, and how to appraise them. (30 minutes)

Diagnostic accuracy: sensitivity and specificity revisited
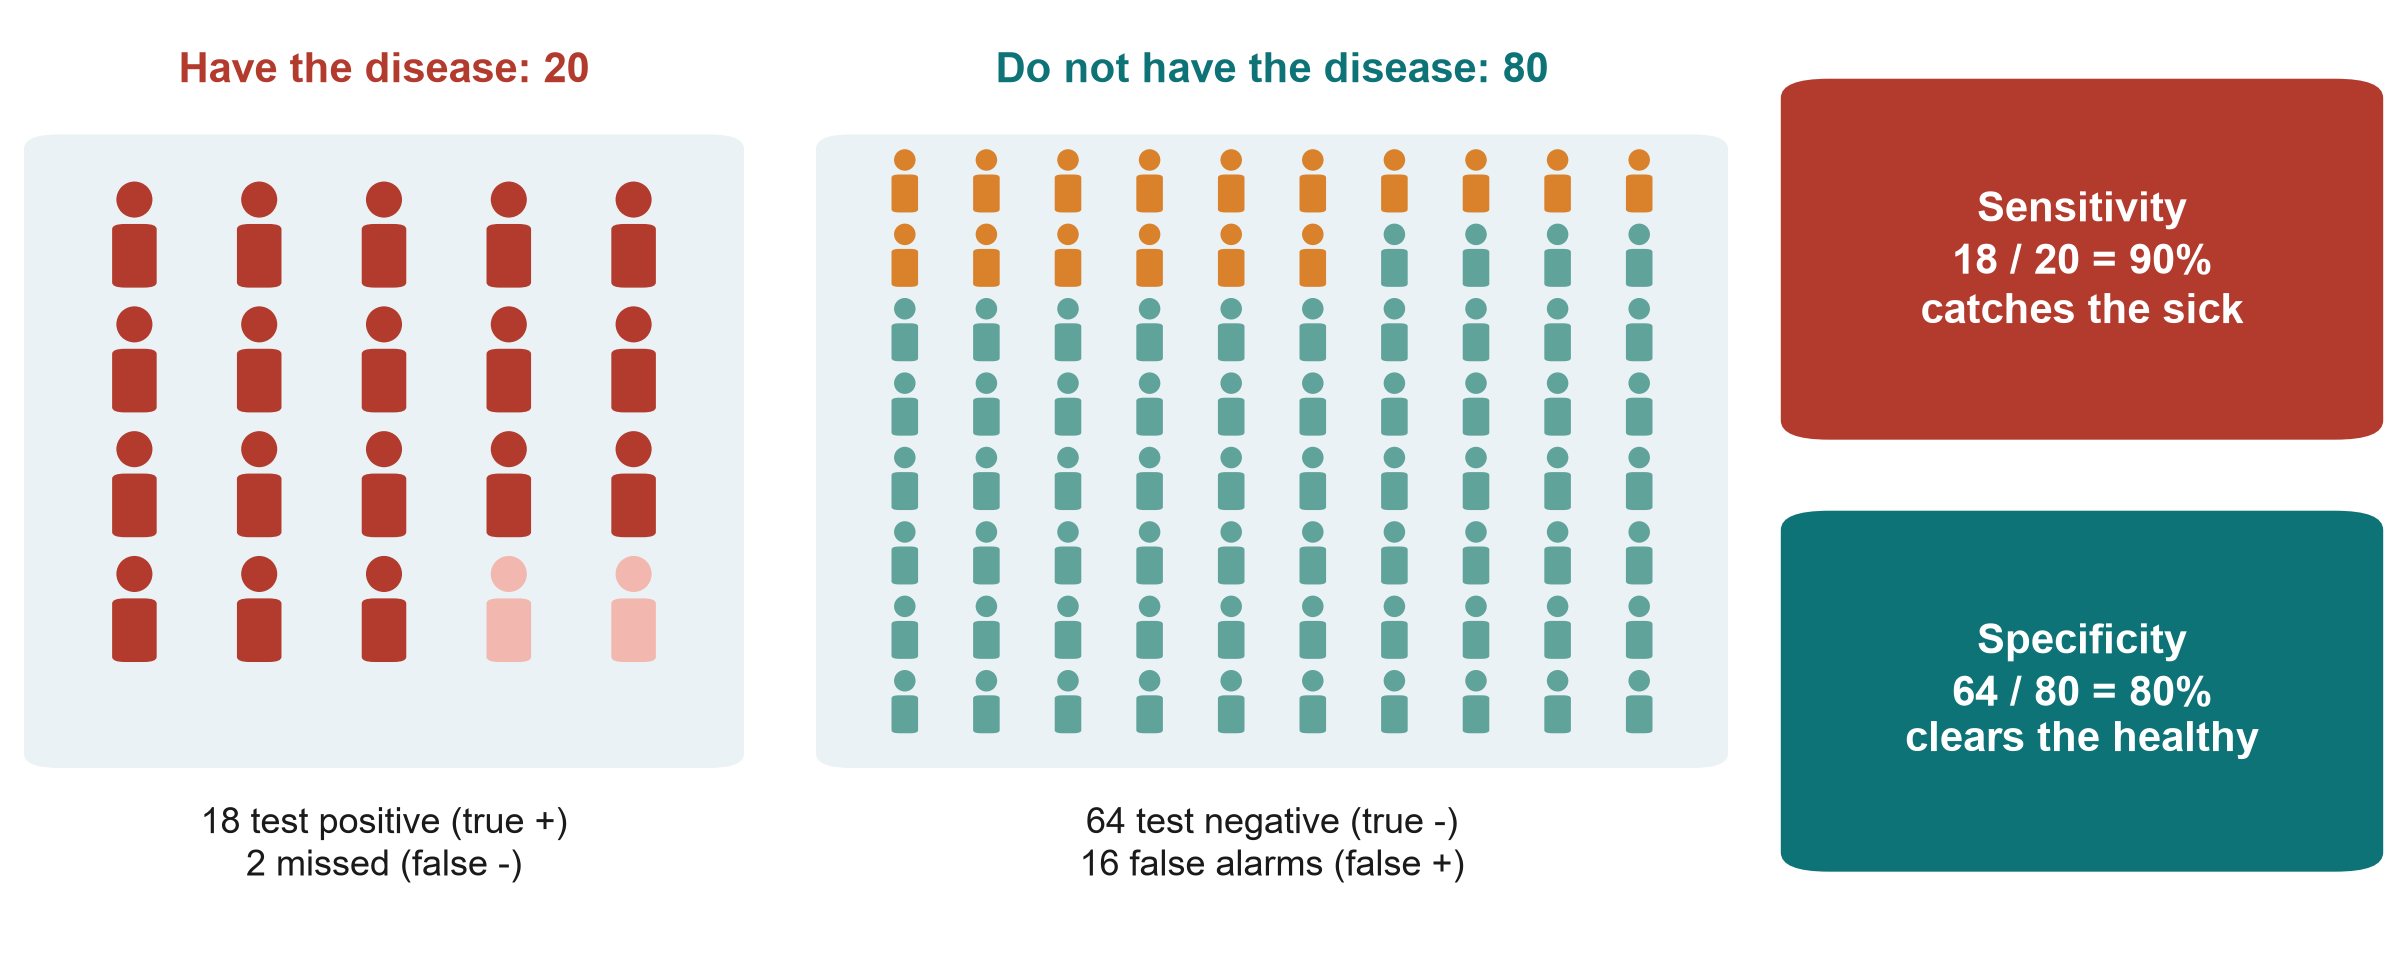
KEY MESSAGE Sensitivity catches the sick. Specificity clears the healthy.

Same test, different setting: PPV depends on prevalence
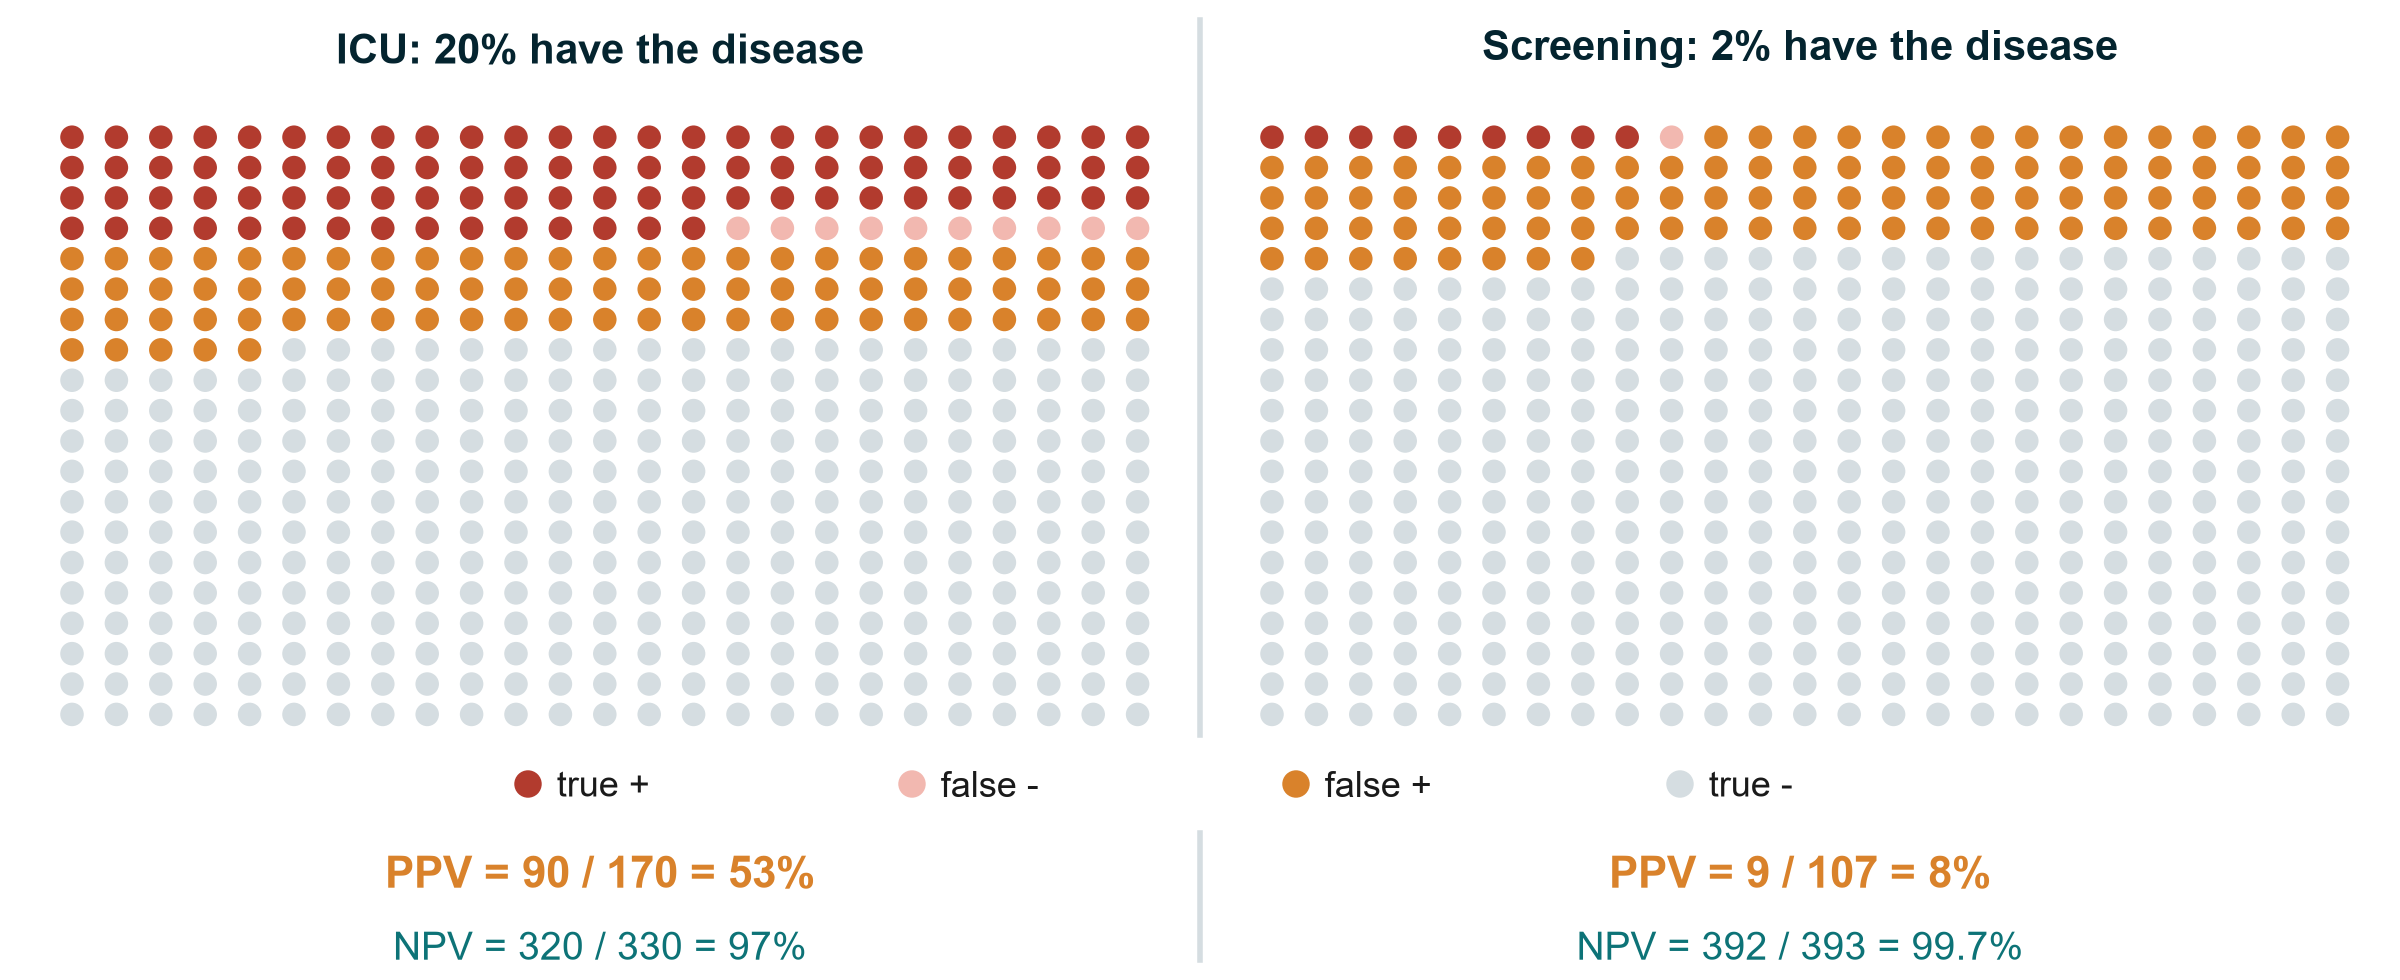
PPV, NPV: positive and negative predictive values, the chance that a positive or a negative result is right

KEY MESSAGE A positive result means much less when the disease is rare.

The ROC curve and the AUC
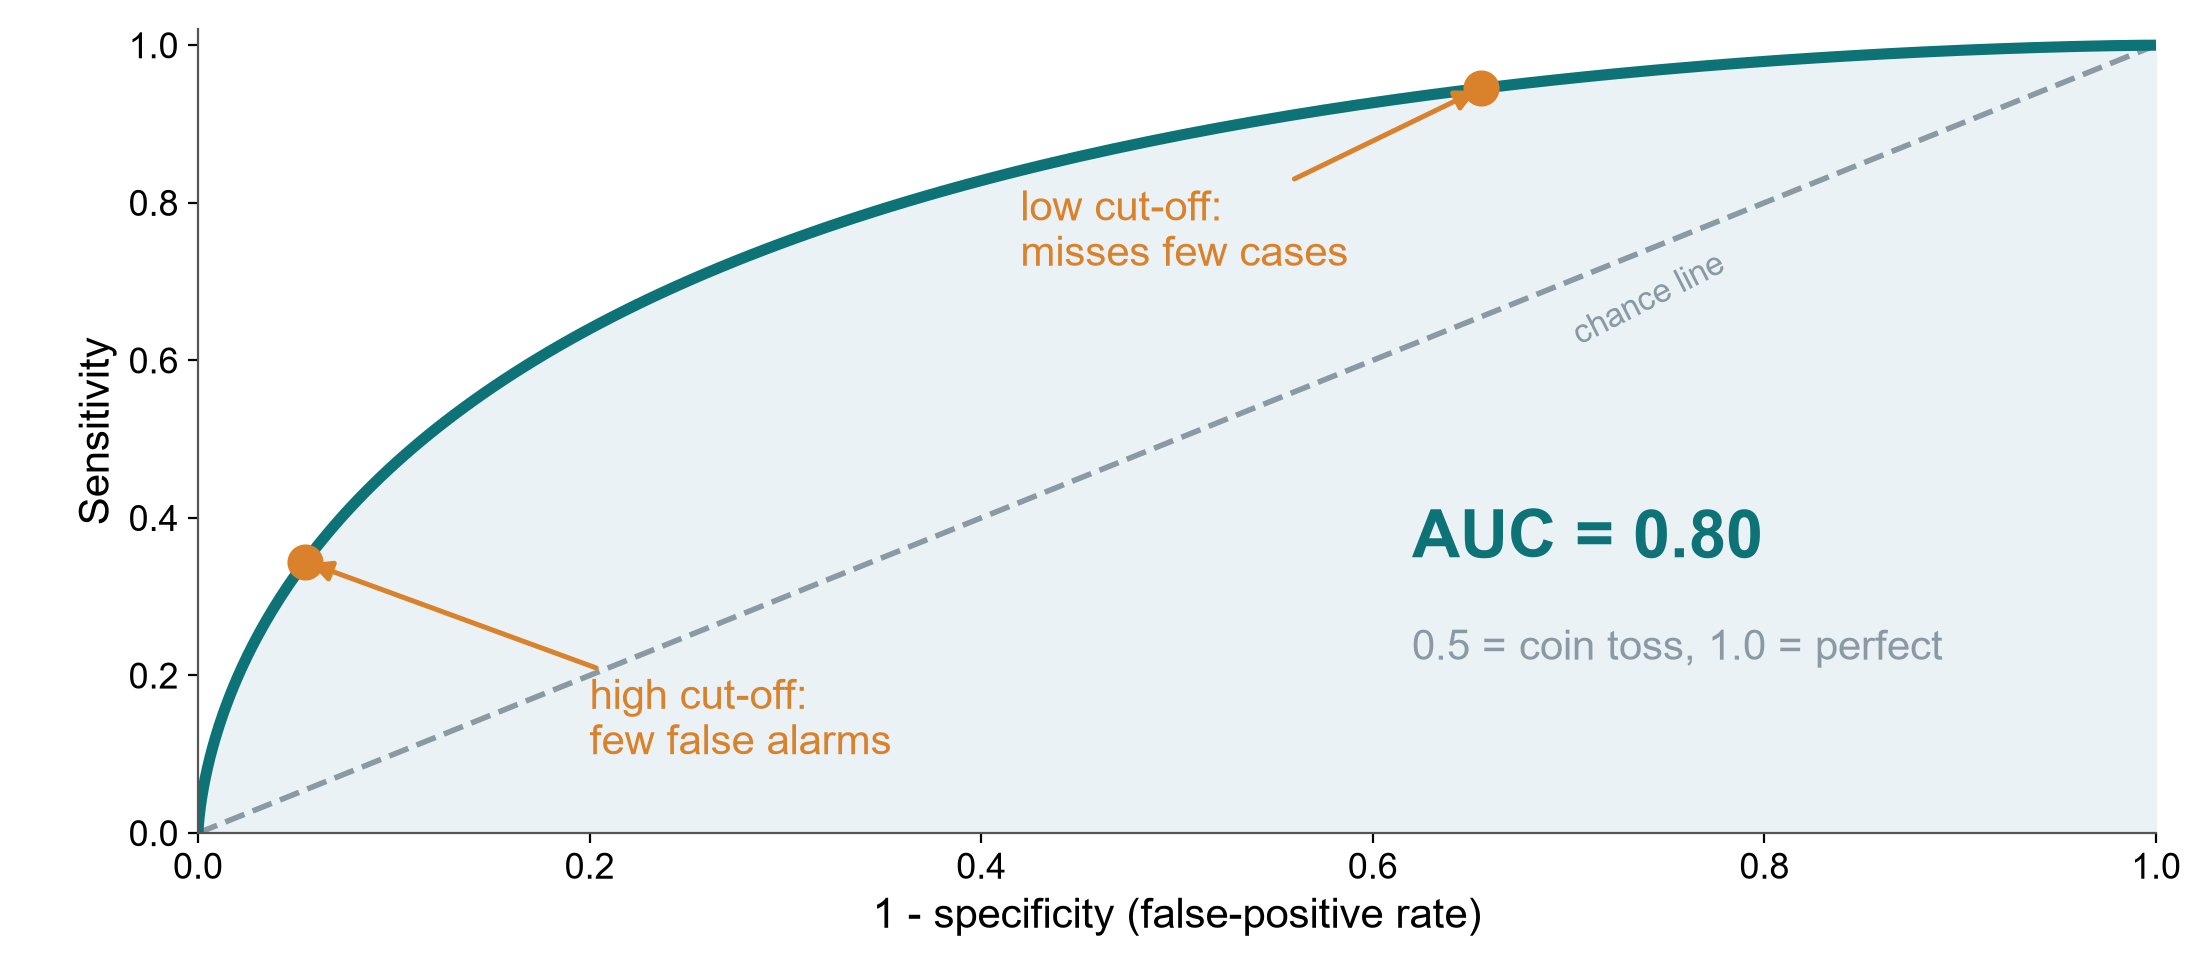
ROC: receiver operating characteristic. AUC: area under the curve. Simulated test.

KEY MESSAGE Each cut-off trades sensitivity for specificity. AUC sums up the whole curve.

The PRISMA flow: from 1,300 records to 9 studies
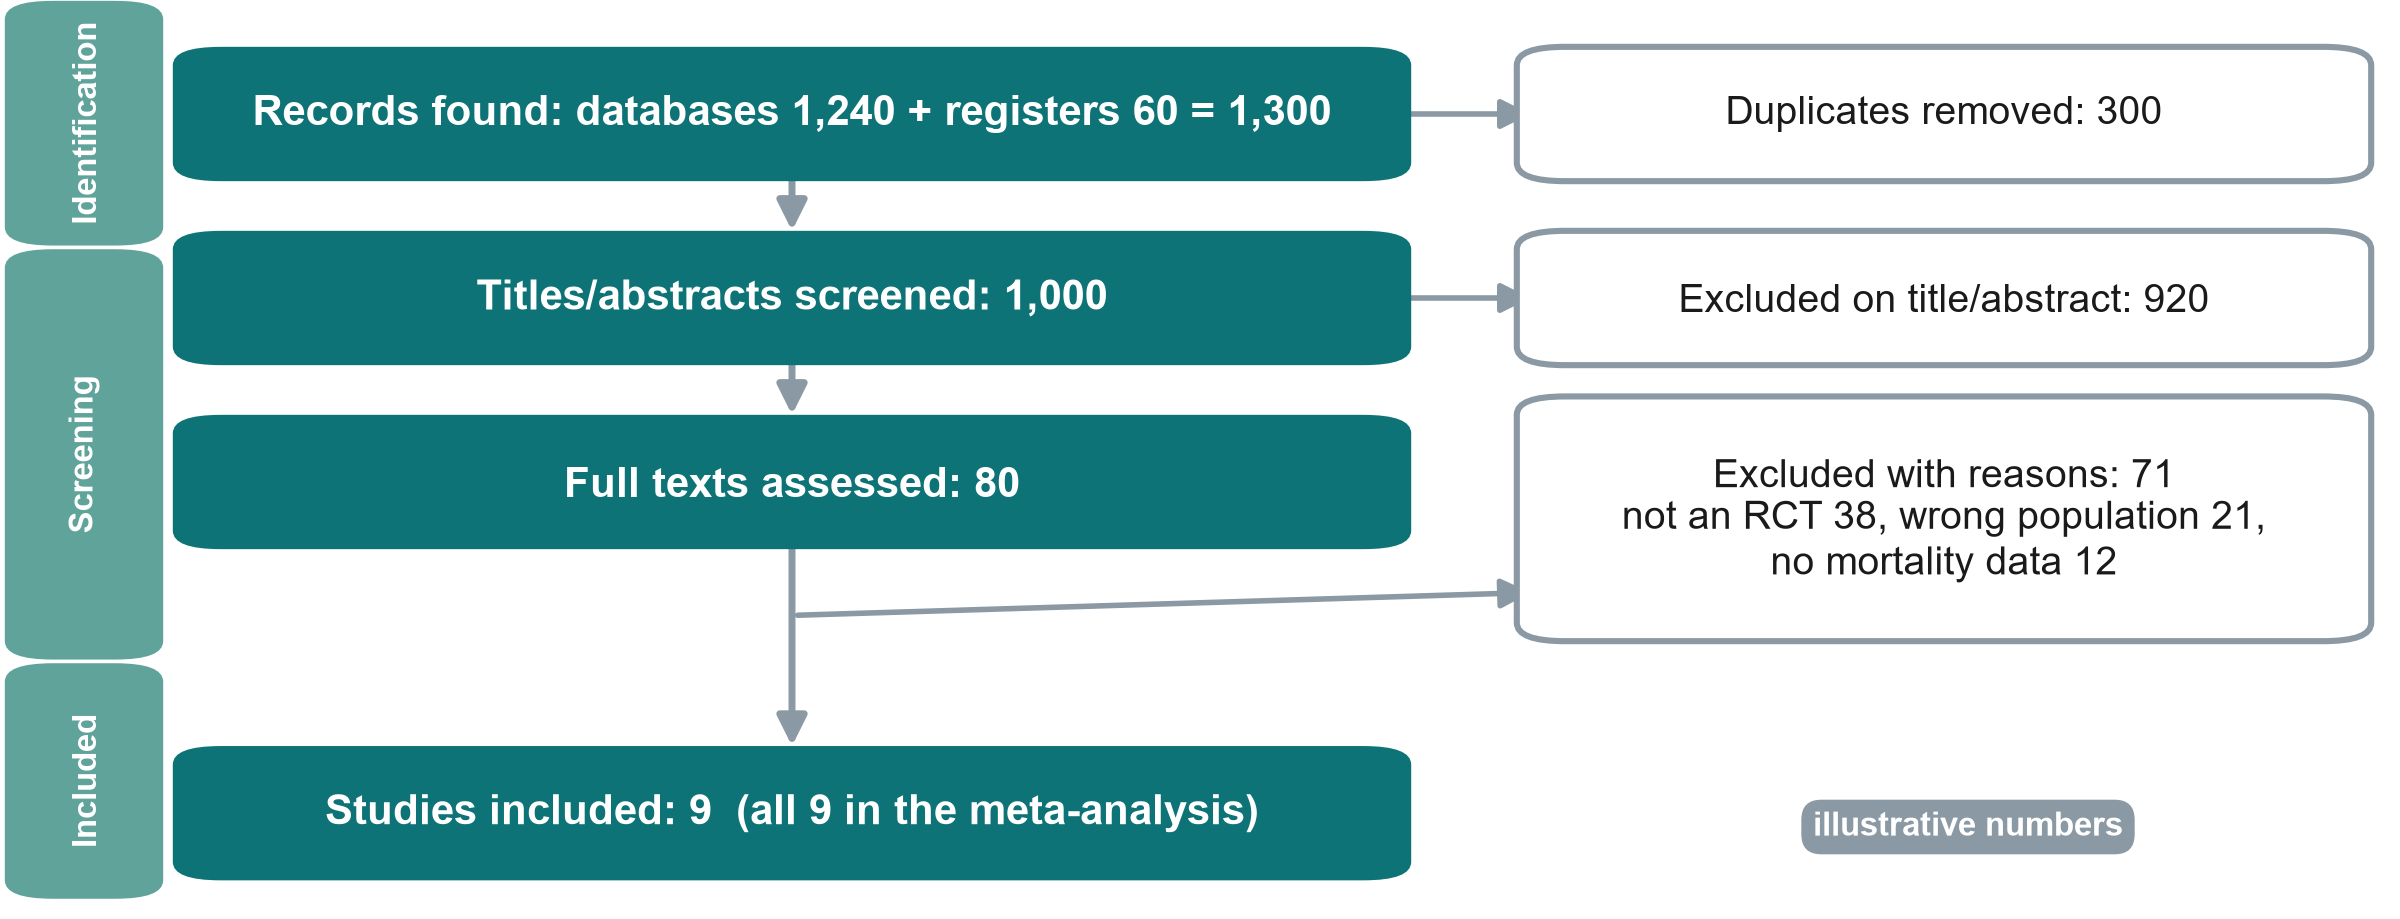
PRISMA: Preferred Reporting Items for Systematic reviews and Meta-Analyses. RCT: randomised controlled trial.

KEY MESSAGE A PRISMA flow shows how studies were found, screened and excluded, with reasons.

Reading a forest plot in four steps
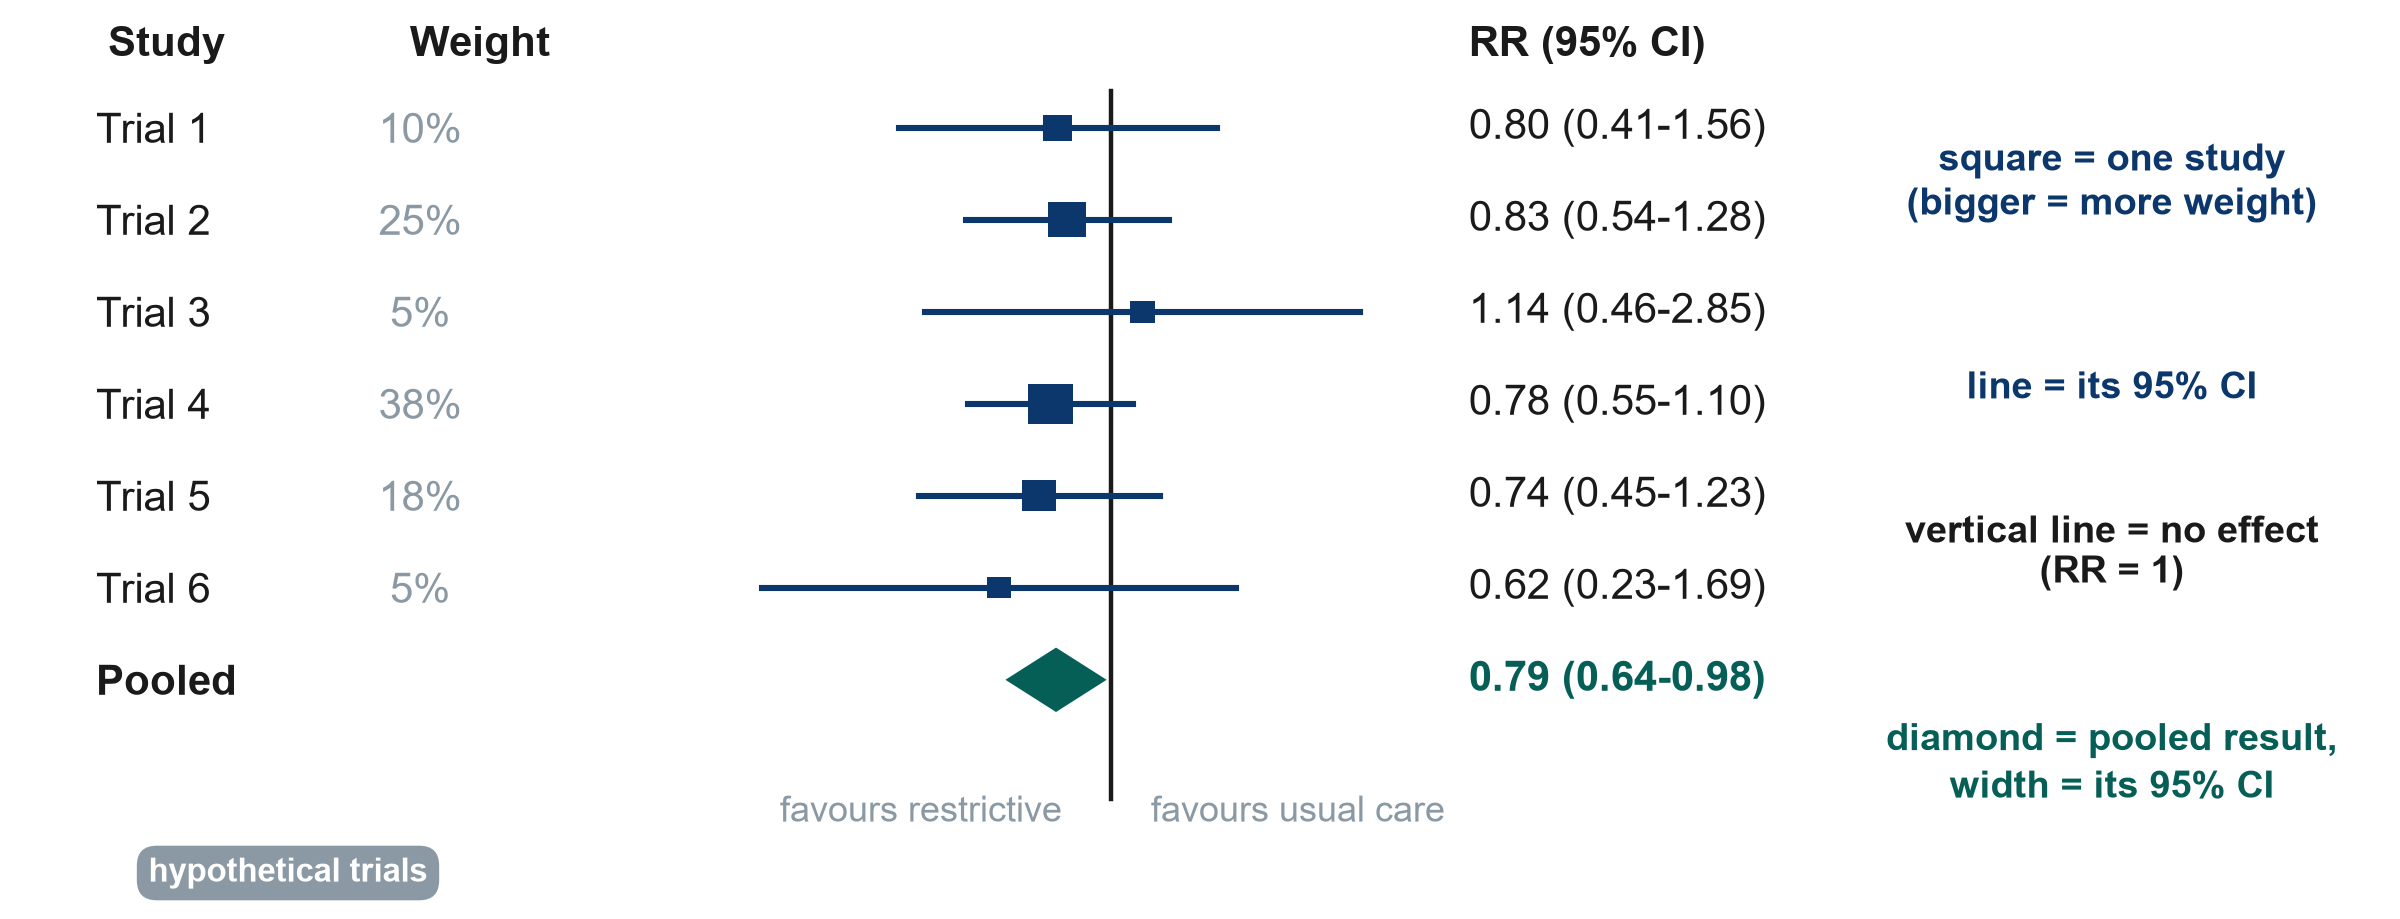
RR: risk ratio, CI: confidence interval

KEY MESSAGE Squares = studies, lines = CIs, diamond = pooled result, vertical line = no effect.

Heterogeneity: do the studies agree?
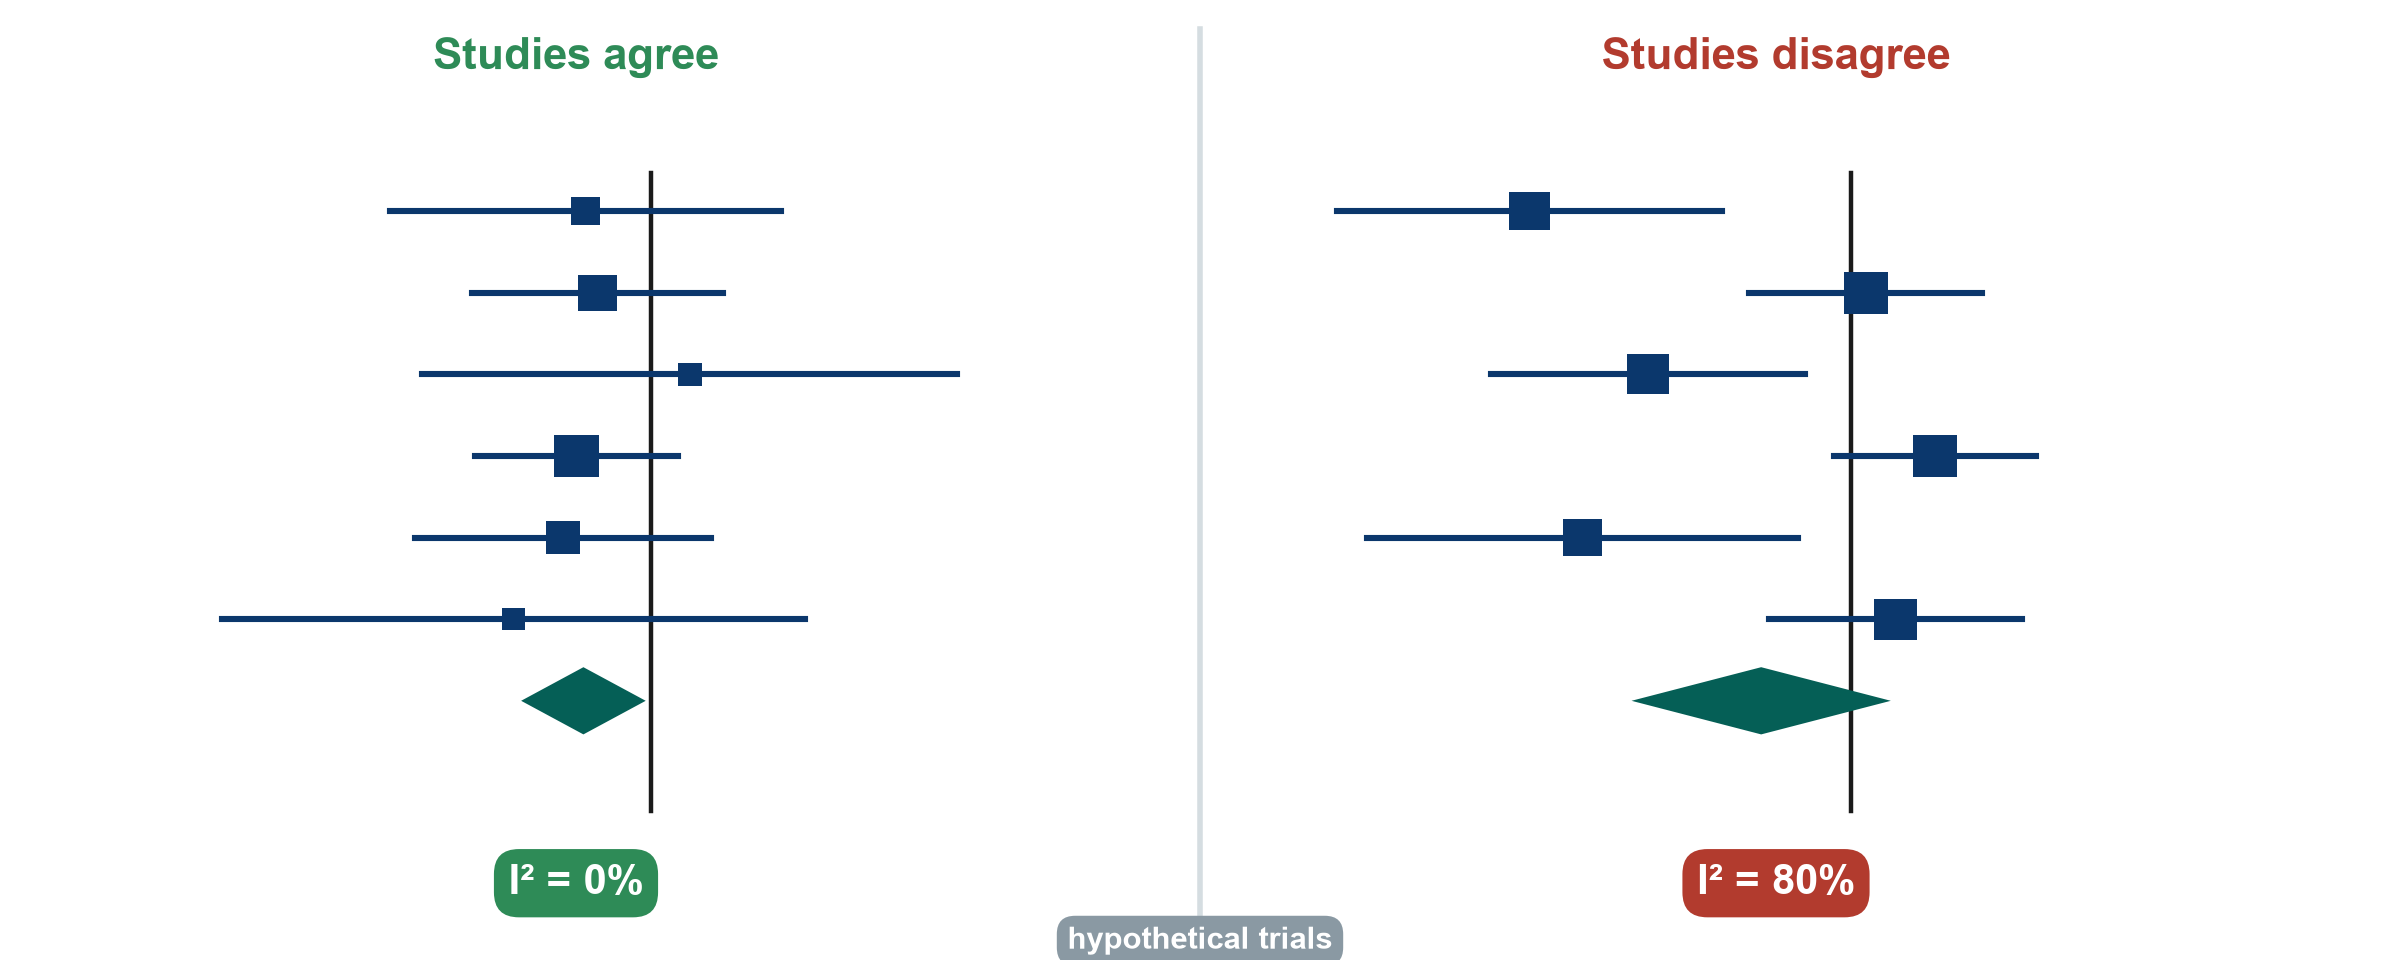
I-squared (i²): the share of the variation between studies that is beyond chance

KEY MESSAGE High I-squared means the studies disagree: find out why before trusting the diamond.

Which risk-of-bias tool for which design?

If the study is a… Appraise it with Report it with Course example
Randomised trial RoB 2 CONSORT Paper 1 (Boulet)
Non-randomised study of an intervention ROBINS-I TREND or STROBE
Cohort or case-control study of an exposure Newcastle-Ottawa Scale (or ROBINS-E) STROBE Paper 2 (Hyun)
Diagnostic accuracy study QUADAS-2 STARD
Systematic review AMSTAR 2 PRISMA

RoB 2: Cochrane risk-of-bias tool for randomised trials. ROBINS-I / -E: risk of bias in non-randomised studies of interventions / exposures. QUADAS-2: for diagnostic accuracy studies. AMSTAR 2: for systematic reviews. The reporting guidelines are covered in Session 8.

The last question: are the conclusions supported by the data?

Questions 7-9 of the 10-question appraisal checklist used in Session 8 (Course/Resources)

Words match the design

  • ‘Caused’ needs randomisation
  • Observational: ‘associated with’
  • Pilot: feasibility, not effect

Numbers match the words

  • Effect size with its 95% CI
  • Relative and absolute effect
  • No ‘trend’ for p = 0.42

Honest limits, no spin

  • Primary outcome reported first
  • Main limitations stated
  • Conclusion based on the primary result

KEY MESSAGE Read the conclusion last, and check it against the design and the numbers.

Exercise: read the forest plot, pick the tool

WHOLE-CLASS TASK · 8 min

  • Session 4 exercise sheet (PDF), Part E: the forest plot of six fluid trials, also on the shared screen
  • Poll: which trial carries the most weight?
  • Poll: does any single trial show a clear effect?
  • Poll: does the diamond cross RR = 1? Say the result in one sentence
  • Poll: the risk-of-bias tool for Paper 1 (Boulet), Paper 2 (Hyun) and a review of fluid trials

Reminder

  • Square = one study
  • Line = 95% confidence interval
  • Diamond = pooled result
  • Tools: see the table two slides back

OUTPUT One class sentence on the pooled result, and three tools named

Outcomes: one primary, defined by what, how and when

The running example (observational version)

What

  • Death from any cause
  • Not ‘mortality improved’

How

  • Hospital record
  • Phone call if discharged

When

  • Day 28 after ICU admission
  • The same day for every patient

2-3 secondary outcomes

  • Acute kidney injury by day 7
  • Ventilator-free days to day 28
  • ICU length of stay

KEY MESSAGE Decide the primary outcome before you see the data, and report it first.

Proposal builder 4: exposure, outcomes and biases

PROPOSAL BUILDER · 40 min

  • Watch: the instructor writes Part 2b live for the running example (15 min)
  • Exposure or intervention, and comparator: exactly what, how much, when
  • One primary outcome (what, how, when) and 2-3 secondary outcomes
  • Two main biases, a concrete fix for each, and ‘caused’ or ‘associated’
  • Your turn: draft the same for your own question (16 min, quiet individual work)
  • Three volunteers read one bias and its fix aloud for feedback (7 min)

Check your draft

  • Comparator stated?
  • Only one primary outcome?
  • Outcome has a time point?
  • Confounding by indication?
  • A concrete fix for each bias?

OUTPUT Your own Proposal Part 2 complete (2a from Session 3, 2b today). Finish it as homework

Session 4 in one slide

4.1 Trust

  • Bias: size does not fix it
  • Confounding: remove it
  • Effect modification: report it

4.2 Size

  • Relative: RR, OR
  • Absolute: RD, NNT
  • OR close to RR only if rare

4.3 Many studies

  • PPV depends on prevalence
  • Forest plot: read the diamond
  • Right tool for the design

Your proposal

  • Part 2 complete
  • Caused or associated?

KEY MESSAGE Trust first, then size, and check that the words match the design.

Wrap-up and homework

DISCUSSION · 5 min

  • Exit question (chat or 1-question form): ICU patients who received more fluid died more often. Give one reason other than the fluid
  • Why: it checks today’s key idea. The instructor reads every answer and opens Session 5 with them
  • Homework: finish your own Proposal Part 2 (exposure, comparator, outcomes, biases)
  • Optional: exercise sheet Parts B and D (effect modification, PPV in two settings)
  • Next Saturday (Session 5): data, and the course dataset FLUID-ICU

OUTPUT One exit answer per person, in the chat or the form

Extra slides: Session 4

Extra slides: Session 4

Use if time allows, or for self-study

More practice (other examples): which bias?

QUICK QUIZ · 2 min

  • A. Only patients who survived to hospital discharge are interviewed about their ICU care
  • B. The nurse who knows each patient’s group scores their pain
  • C. A scale that always reads 0.5 kg too high is used on one ward only

Choose

  • Selection bias
  • Observer bias
  • Measurement bias

OUTPUT One bias for each (answers in the notes)

Other examples: find the confounder

In each, a third factor drives both the exposure and the outcome

Antibiotics and death

  • More antibiotics, more deaths?
  • Confounder: severity of infection
  • Sicker patients get more drugs

Dietitian and weight loss

  • Seen by a dietitian, more weight loss?
  • Confounder: malnutrition at admission
  • The reason for referral

Vasopressors and arrhythmia

  • Vasopressors, more arrhythmia?
  • Confounder: depth of shock
  • Partly a drug effect too

KEY MESSAGE Ask: why did these patients receive the exposure? That reason may be the confounder.

Likelihood ratios (LR) and reporting diagnostic studies

Same test: sensitivity 90%, specificity 80%

LR+ (positive test)

  • sensitivity / (1 - specificity)
  • 0.90 / 0.20 = 4.5
  • A positive result is 4.5 times as likely in the sick

LR- (negative test)

  • (1 - sensitivity) / specificity
  • 0.10 / 0.80 = 0.13
  • An LR above 10 or below 0.1 changes decisions most

Report and appraise

  • STARD: reporting checklist and flow diagram
  • QUADAS-2: risk of bias
  • Test it on the patients who will use it

KEY MESSAGE Likelihood ratios do not change with prevalence. Predictive values do.

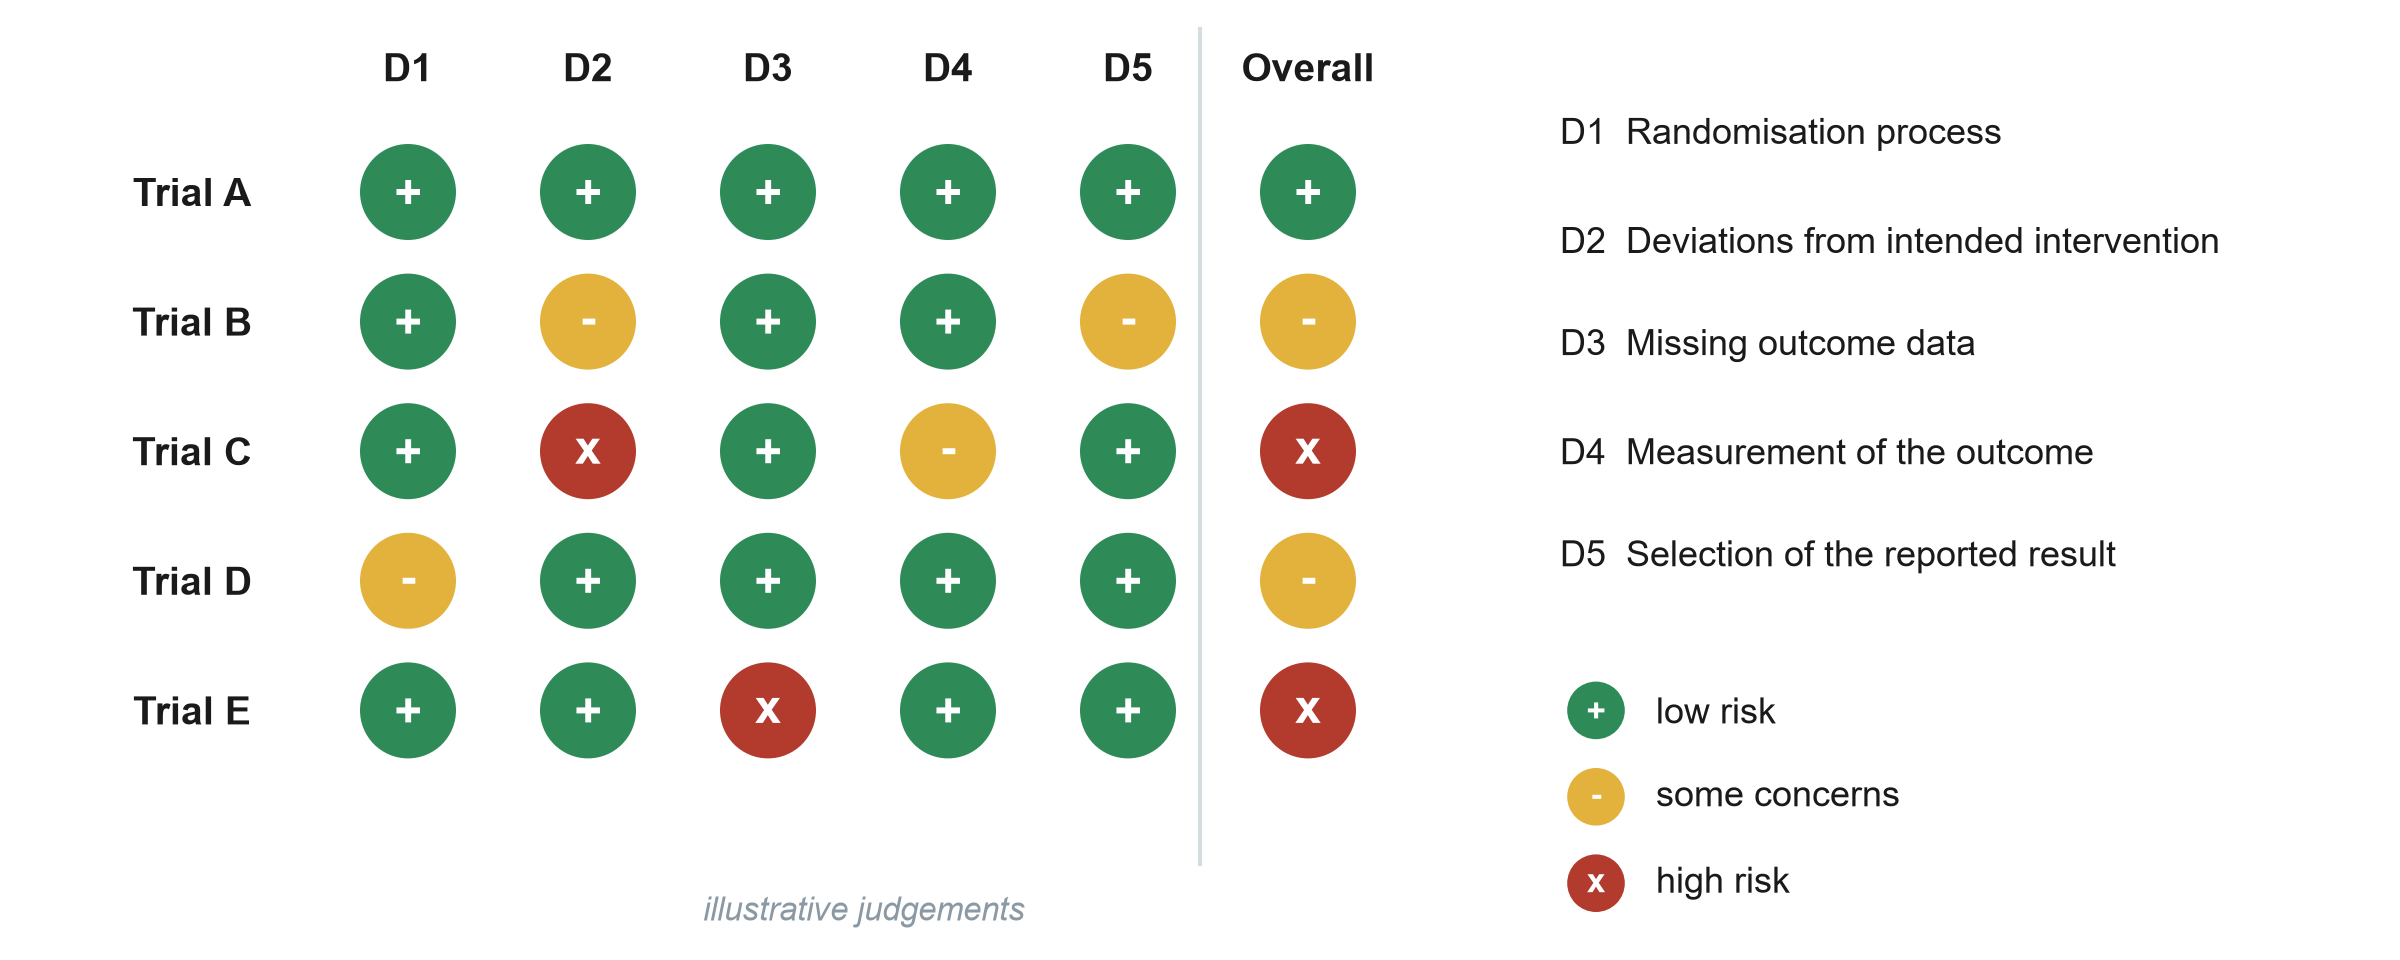
The RoB 2 traffic-light plot

RoB 2: Cochrane risk-of-bias tool for randomised trials. D1-D5: its five domains. Illustrative judgements.

KEY MESSAGE Judge each domain. The overall risk is set by the worst domain.

Worked example: prevalence or incidence?

Today

  • 200 ward patients, 20 have a pressure injury
  • Prevalence 10%

At risk

  • 180 patients without an injury

One week

  • 9 develop a new injury

Incidence

  • 9 / 180 = 5% per week
  • Denominator: only those at risk

KEY MESSAGE Incidence always has a time period and only counts people at risk.