Session 3 · Design: choosing the right study

Foundations of Clinical Research: From Clinical Question to Publication

Vương Mỹ Lượng & Bernard Osang’ir

Neudata Consulting Ltd

Session 3 · Design: choosing the right study

Part 1

Week 3 · Saturday · online, 19:30-22:30

  • Recap quiz on Session 2 (10 min)
  • 3.1 Study designs in pictures (45 min)
  • Whole-class exercise: Name that design (15 min)
  • Break (15 min)
  • 3.2 More designs: trial variants, pilots, quality improvement, qualitative (30 min)
  • Whole-class exercise: choose the design (15 min)
  • Proposal builder 3: design, setting and population (45 min), then wrap-up (5 min)

Recap quiz: three questions on Session 2

QUICK QUIZ · 9 min

  • Q1. Your PubMed search finds 3,000 papers. Add a concept with AND, or a synonym with OR?
  • Q2. After the title and abstract, what do you read next in a paper?
  • Q3. An abstract says ‘a trend towards lower mortality (p = 0.42)’. What is this called?
  • Then re-read your own research question (your Proposal Part 1 from Sessions 1 and 2): 3 min

How we run it

  • Answer in the poll (30 s each)
  • Results on screen, then the answer
  • No marks, just a warm-up

OUTPUT Poll answers, and your own question re-read

Key words of the day

The words you will use today (no need to memorise definitions)

The pieces

  • Exposure: what comes first
  • Outcome: what we count later
  • Comparison group

Who decides?

  • Observational: we watch
  • Experimental: we assign
  • Randomised: chance assigns

Which way in time?

  • Cross-sectional: snapshot
  • Case-control: look back
  • Cohort: follow forward

After the break

  • Cluster and crossover trials
  • Non-inferiority and pilot trials
  • Time series, qualitative

KEY MESSAGE Two questions name most designs: who decided the exposure, and which way does time run?

One question, two designs

In adults with septic shock, does a restrictive fluid strategy reduce 28-day mortality? Both papers: course folder, Course/Papers

Paper 1: Boulet 2024, randomised trial

  • 50 patients randomised, 48 analysed
  • Restrictive (non-resuscitation) fluids vs usual care
  • Primary outcome: fluid balance at day 5
  • The investigator assigns the strategy

Paper 2: Hyun 2023, cohort study

  • Sepsis registry: 11,981 patients, 20 hospitals
  • Positive vs negative fluid balance, days 1-3
  • Outcome: death by day 28 (matched pairs)
  • The investigator observes what happened

KEY MESSAGE Same question, two designs: the design decides what you may claim.

3.1 Study designs in pictures

Did the investigator assign the exposure, or just watch?

That one question sorts almost every study design. (45 minutes)

Four families of study designs

Descriptive

  • Describes, no comparison
  • Case report or case series
  • Cross-sectional survey

Observational

  • Compares groups, we watch
  • Case-control
  • Cohort (prospective or retrospective)

Experimental

  • Compares groups, we assign
  • Randomised controlled trial (RCT)
  • Non-randomised trial

Studies of studies

  • Combine many studies
  • Systematic review
  • Meta-analysis

KEY MESSAGE Descriptive designs describe. Analytical designs (observational and experimental) compare groups.

Exposure and outcome: the two words you need

Example Exposure (comes first) Outcome (counted later)
Paper 2: Hyun 2023, cohort Positive fluid balance by day 3 Death by day 28
Paper 1: Boulet 2024, RCT Restrictive fluid strategy Fluid balance at day 5
Another example: ICU infection Parenteral (intravenous) nutrition Candidaemia (Candida in the blood)
Another example: the ward Air mattress Pressure injury

Exposure: a treatment, strategy or risk factor. Outcome: death, infection, injury, a lab value. Comparison group: people without the exposure, or with usual care.

Descriptive designs: describe, do not compare

Case report or case series

  • A few unusual patients, described in detail
  • No comparison group
  • Raises ideas but cannot test them
  • e.g. the first reports of thalidomide harm

Cross-sectional study

  • One snapshot of a whole unit, on one day
  • Gives prevalence: how many have it now
  • Exposure and outcome measured together
  • Cannot show which came first

KEY MESSAGE Descriptive studies raise questions. They cannot answer ‘does X cause Y?’

Another example: a one-day point-prevalence survey

A cross-sectional study you could run next week

Choose a day

  • All inpatients on all wards, one weekday

Examine everyone

  • Two trained nurses, one standard form

Record both

  • Pressure injury (yes or no) and mattress type, at the same visit

Count

  • e.g. 37 of 412 patients = 9% prevalence today

KEY MESSAGE A snapshot gives prevalence. It cannot show which came first.

Case-control: start from the outcome, look back
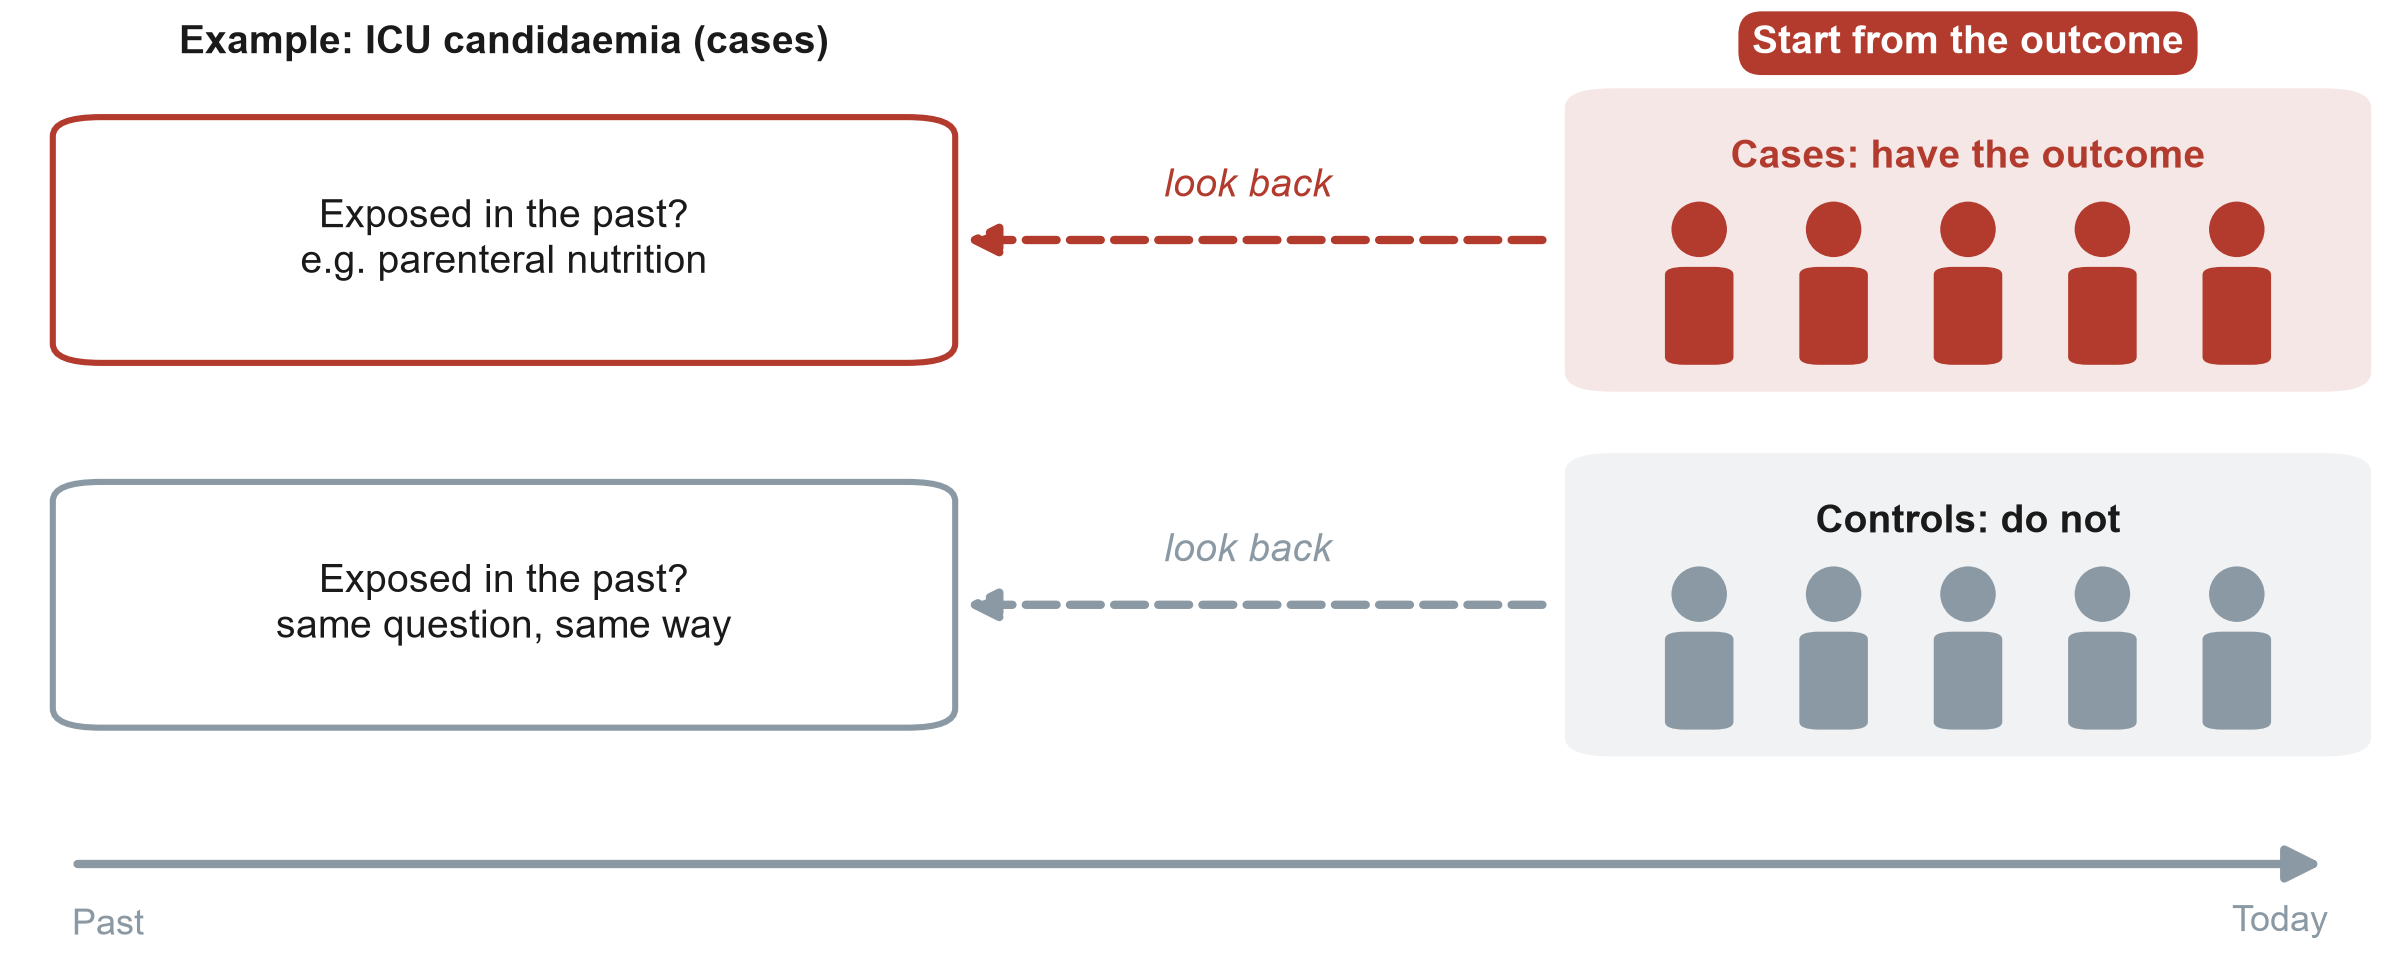
ICU: intensive care unit

KEY MESSAGE Case-control: pick people by outcome, then compare their past exposures.

Another example: a case-control study in the ICU

Question: is parenteral nutrition a risk factor for candidaemia in the ICU?

Find cases

  • 40 ICU patients with candidaemia, from lab records

Find controls

  • 80 ICU patients without it, same units and months

Look back

  • Parenteral nutrition in the 14 days before?

Compare

  • Exposed: 24 of 40 cases vs 16 of 80 controls

Report

  • An odds ratio (OR), calculated in Session 4

KEY MESSAGE Cases and controls are chosen by outcome. Exposure is measured looking back.

Cohort: start from the exposure, follow forward
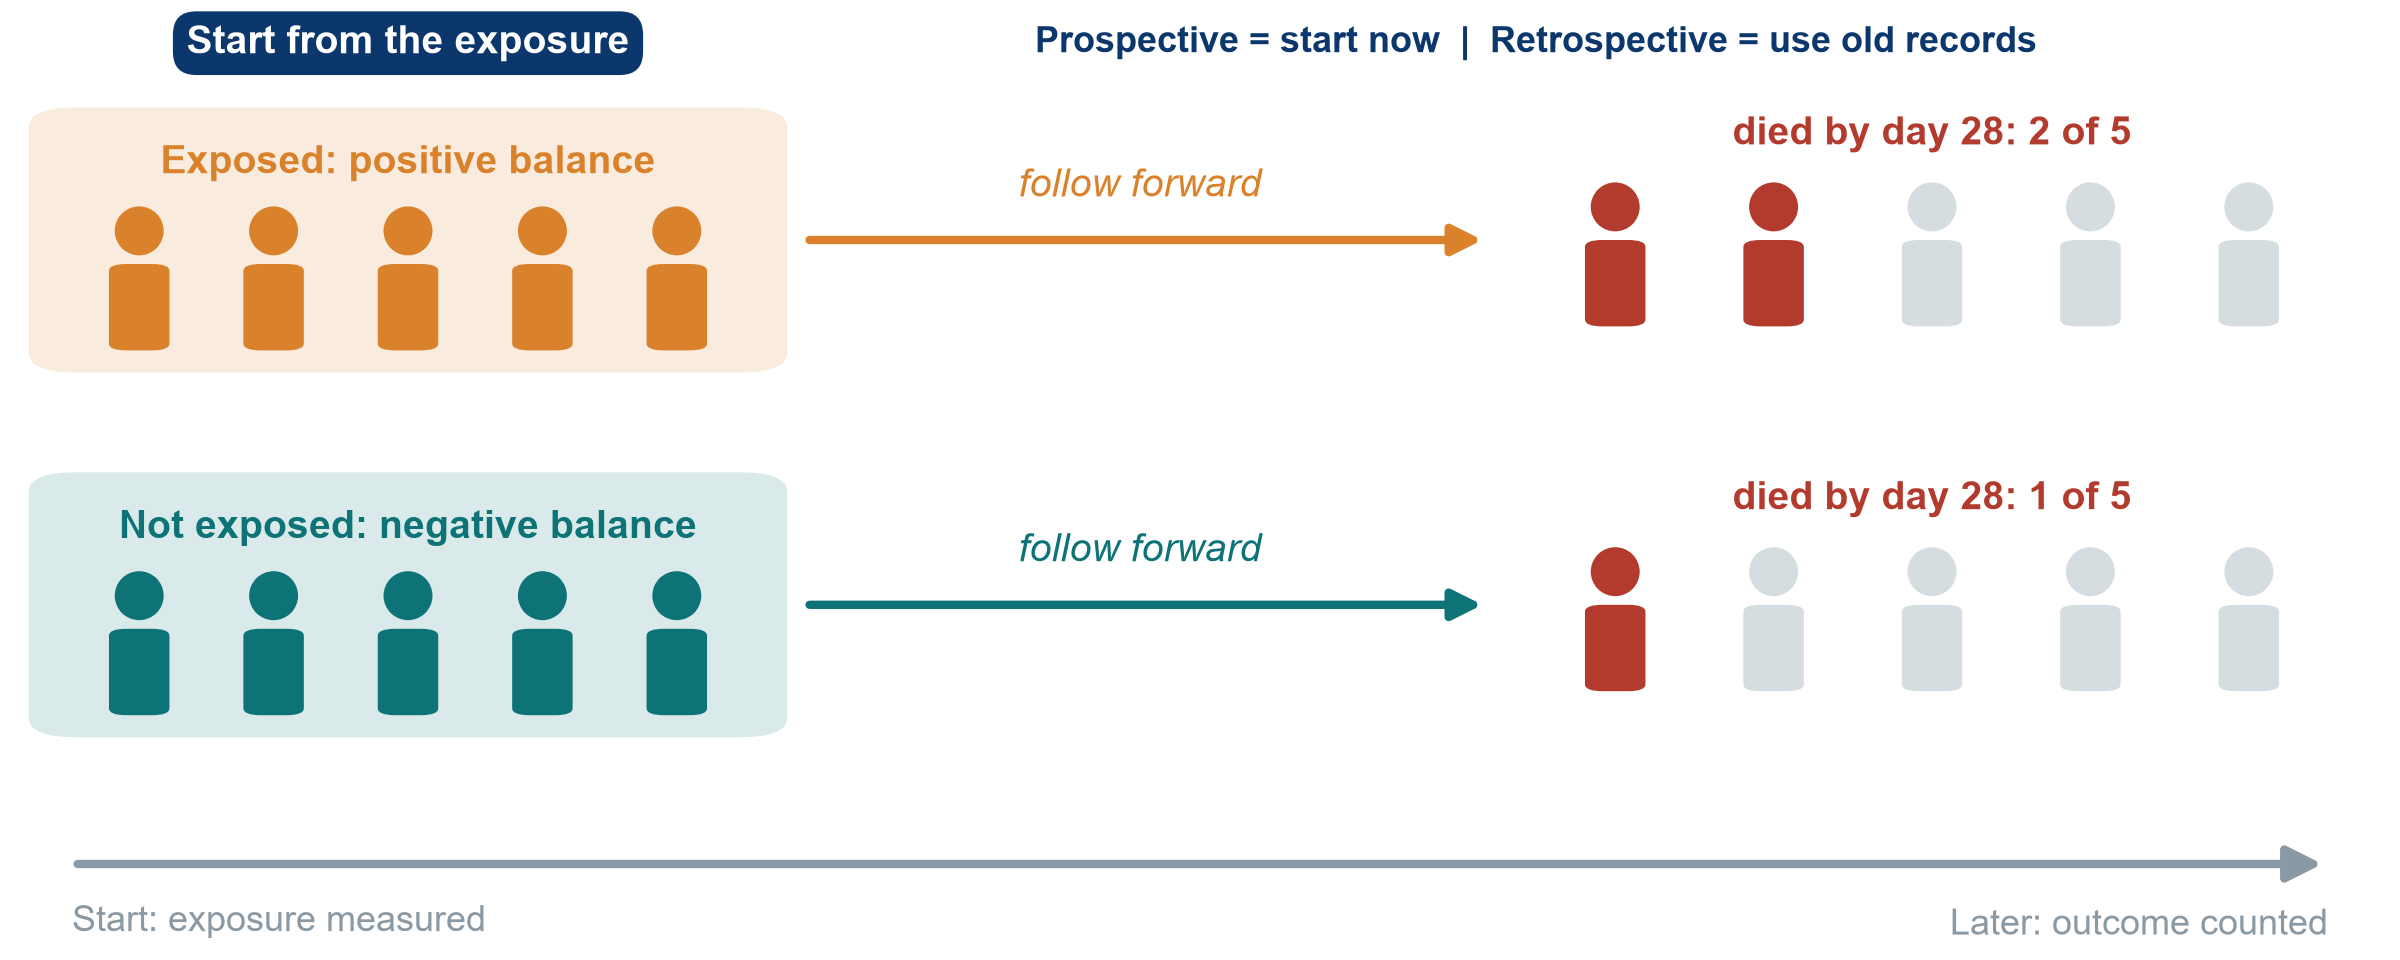
KEY MESSAGE Cohort: exposure first, outcome later, so time runs the right way.

Worked example: Paper 2 (Hyun 2023), step by step

Question: is a positive fluid balance associated with death by day 28?

Define the cohort

  • Adults with sepsis in 20 hospitals, ICU stay of 3 days or more

Measure exposure

  • Cumulative fluid balance, ICU days 1-3: positive or negative

Follow forward

  • Record who dies by day 28

Compare

  • Matched pairs. Hazard ratio (HR) 2.13 for day 2

KEY MESSAGE A cohort groups people by exposure and follows them to the outcome.

RCT (randomised controlled trial): randomise, then follow forward
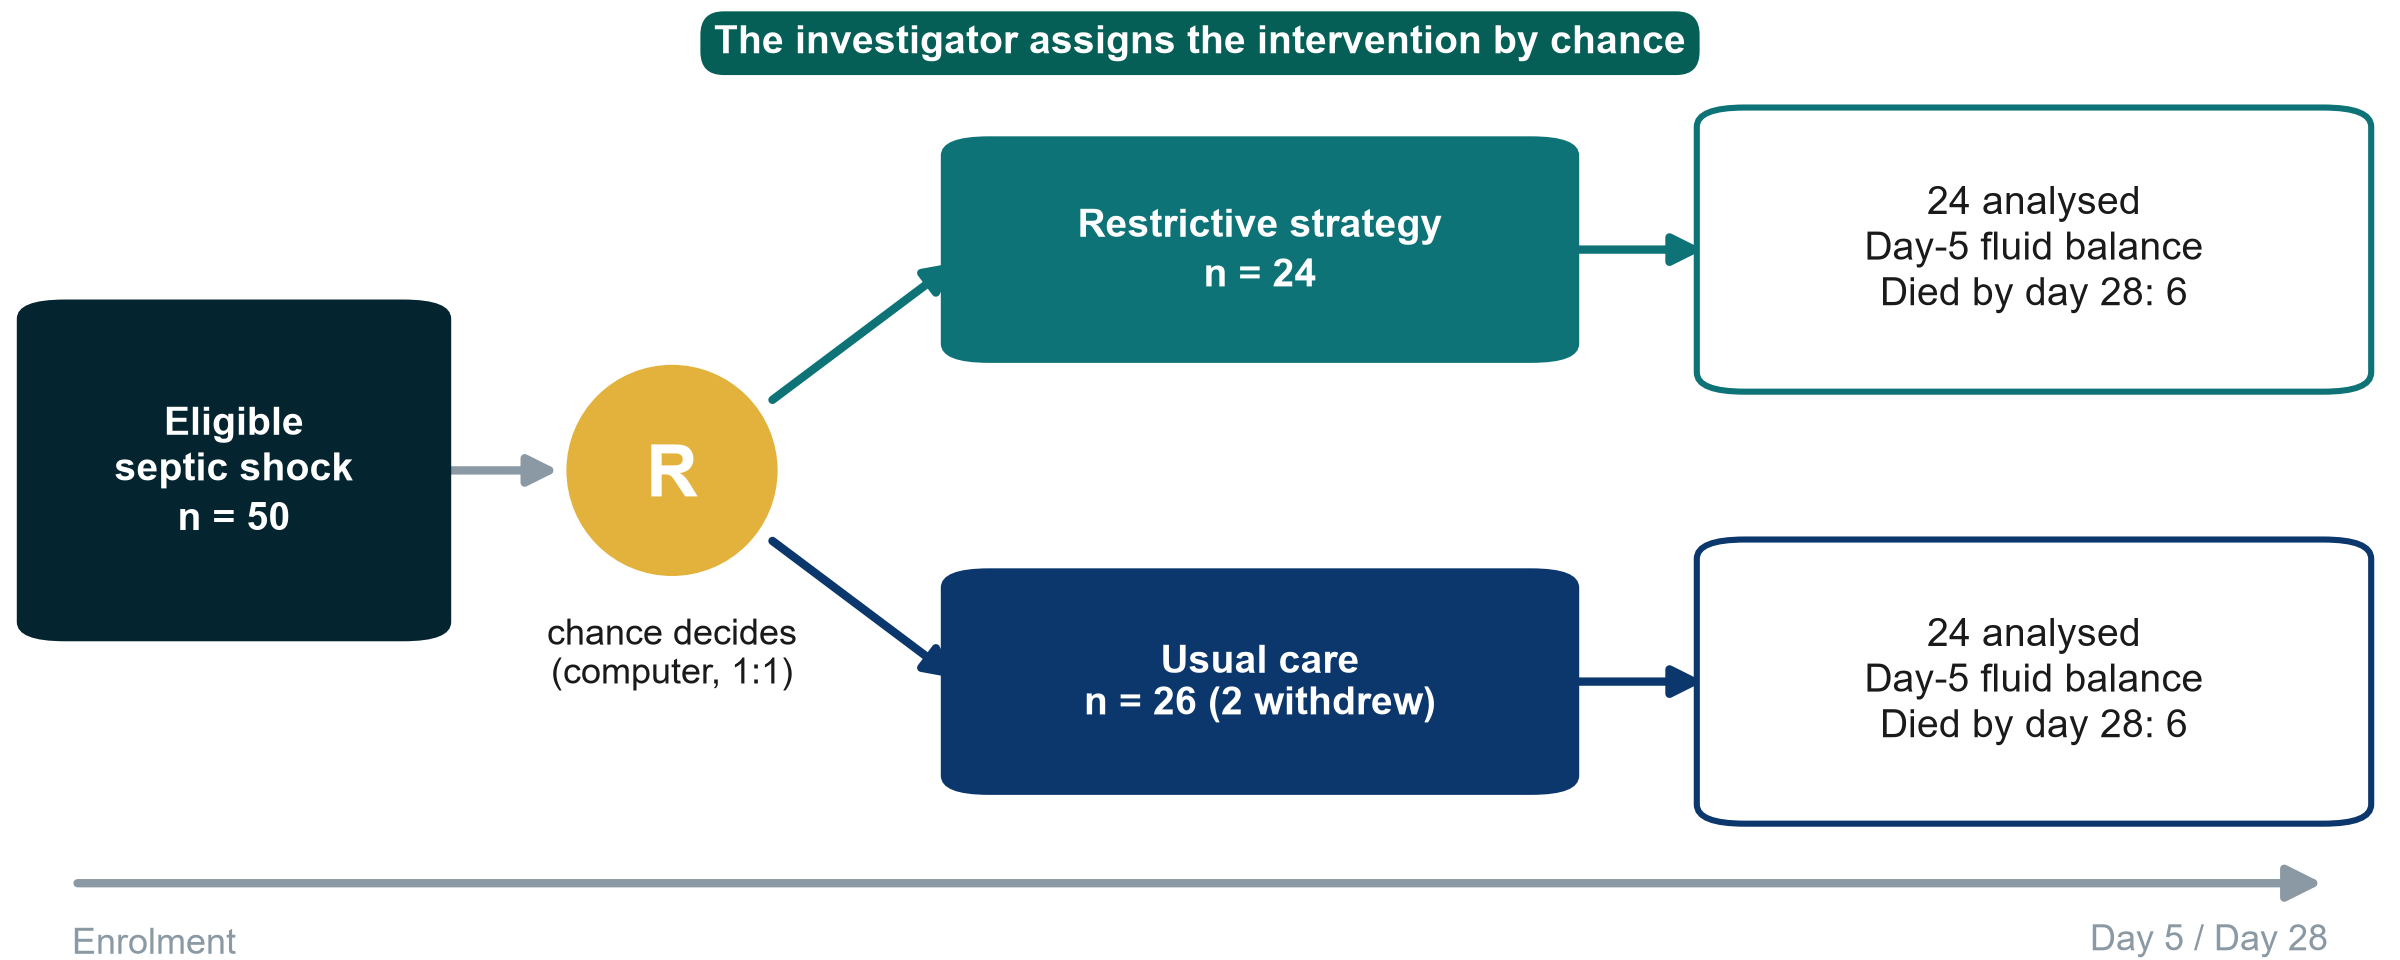
R: randomisation by a central computer, 1:1

KEY MESSAGE In an RCT chance, not the clinician, decides who gets what.

Worked example: Paper 1 (Boulet 2024), step by step

Question: does restricting non-resuscitation fluids reduce the day-5 fluid balance?

Eligibility

  • Septic shock, age 18-85, vasopressor started less than 24 h ago

Consent

  • Patient or legal surrogate

Randomise

  • Central computer, 1:1, so nobody can predict

Treat

  • Restrictive vs usual care for 7 days

Measure

  • Fluid balance at day 5. Death by day 28

KEY MESSAGE In a trial the investigator assigns the exposure by chance.

Systematic reviews and meta-analysis: studies of studies
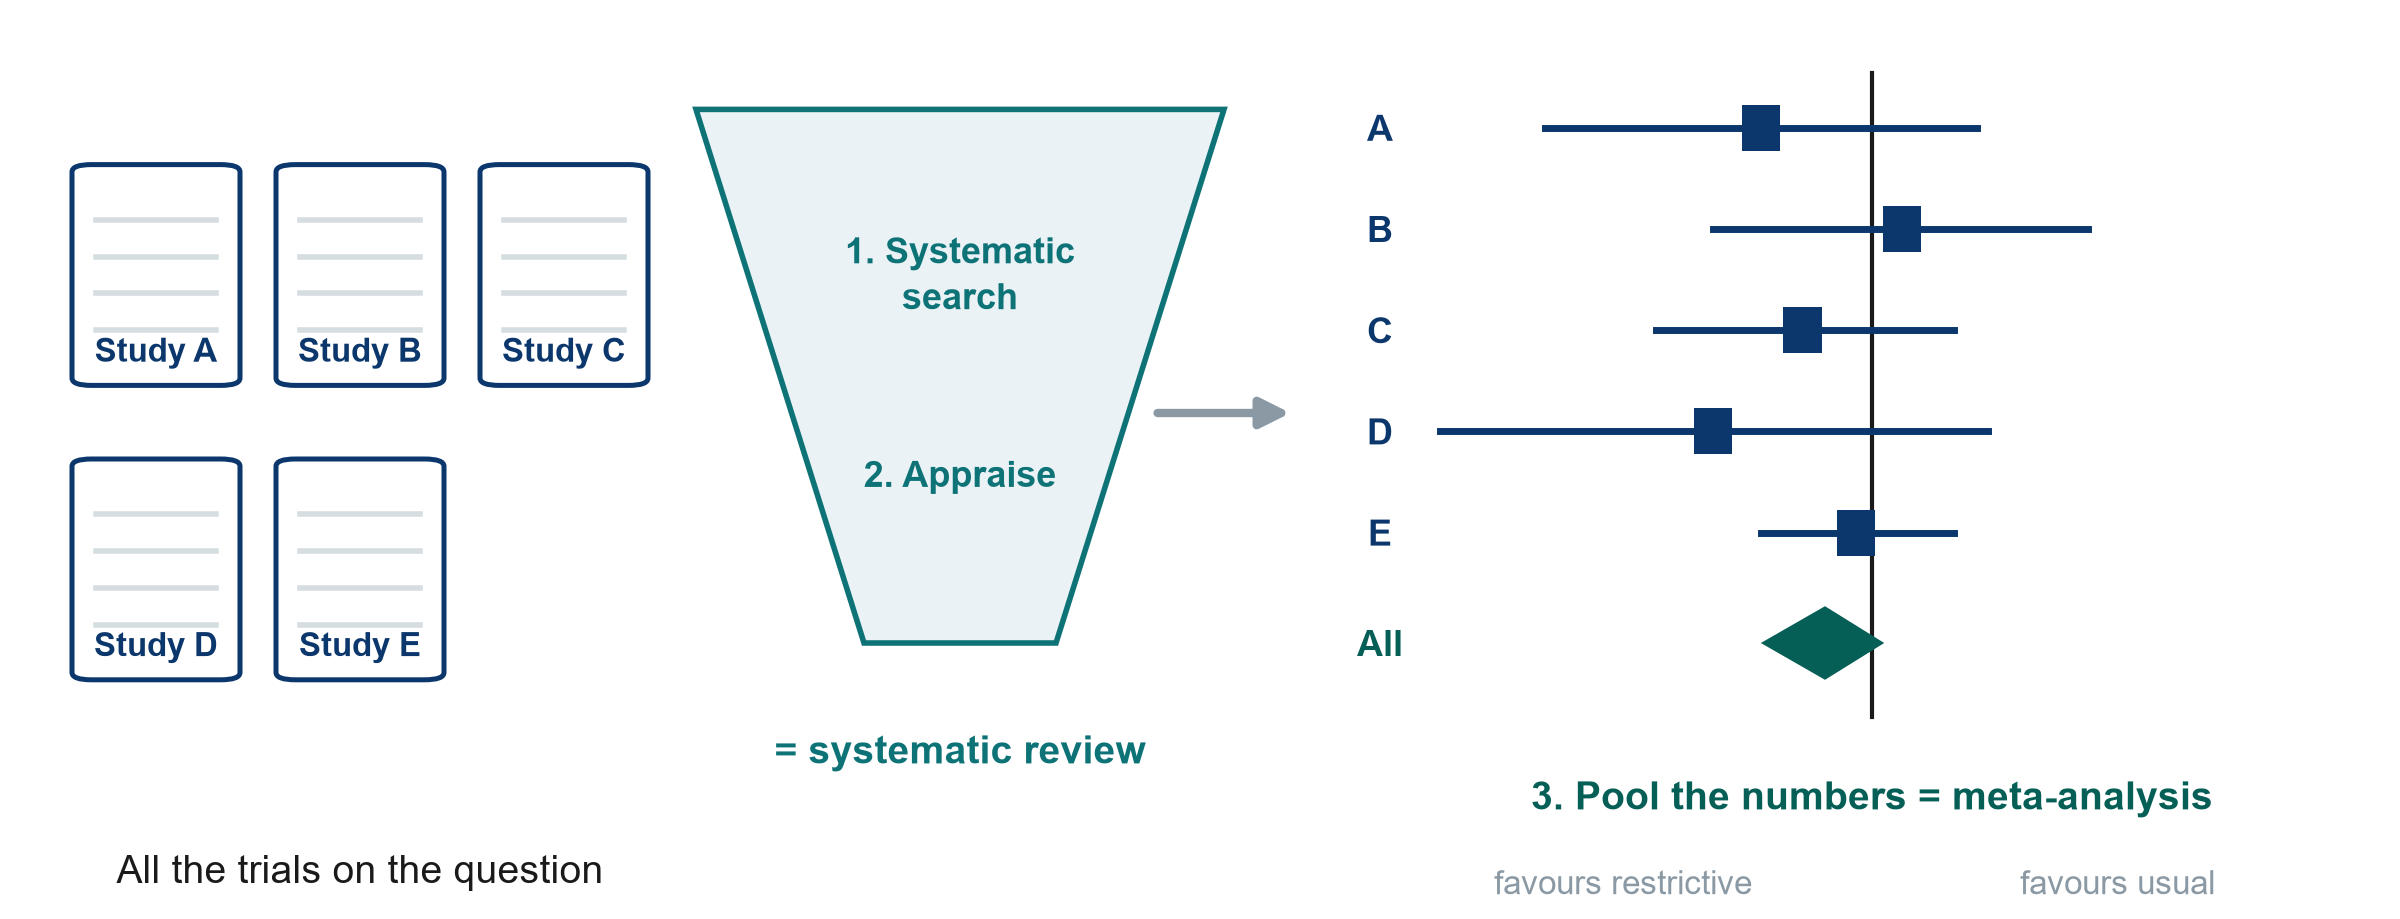
KEY MESSAGE A systematic review searches and appraises. A meta-analysis pools the numbers.

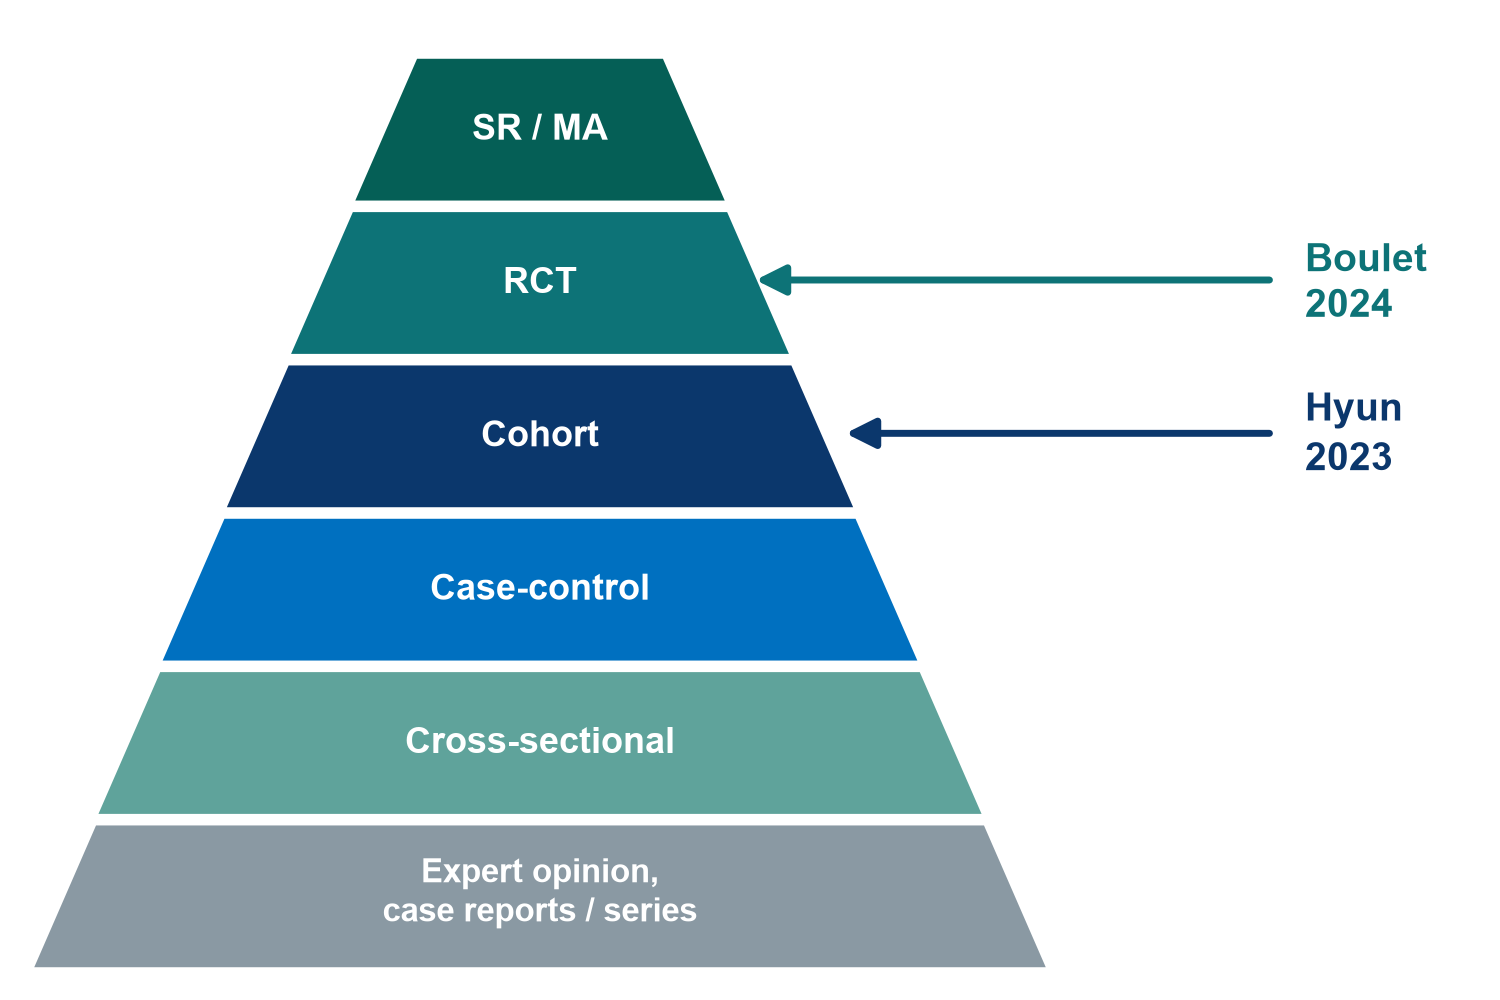
Where the two papers sit on the evidence pyramid

Read it with care

  • SR / MA: systematic review and meta-analysis
  • Higher = less prone to bias, on average
  • A rule of thumb, not a law
  • A good cohort can beat a poor RCT
  • The best design is the one that fits the question
Name the design in three questions
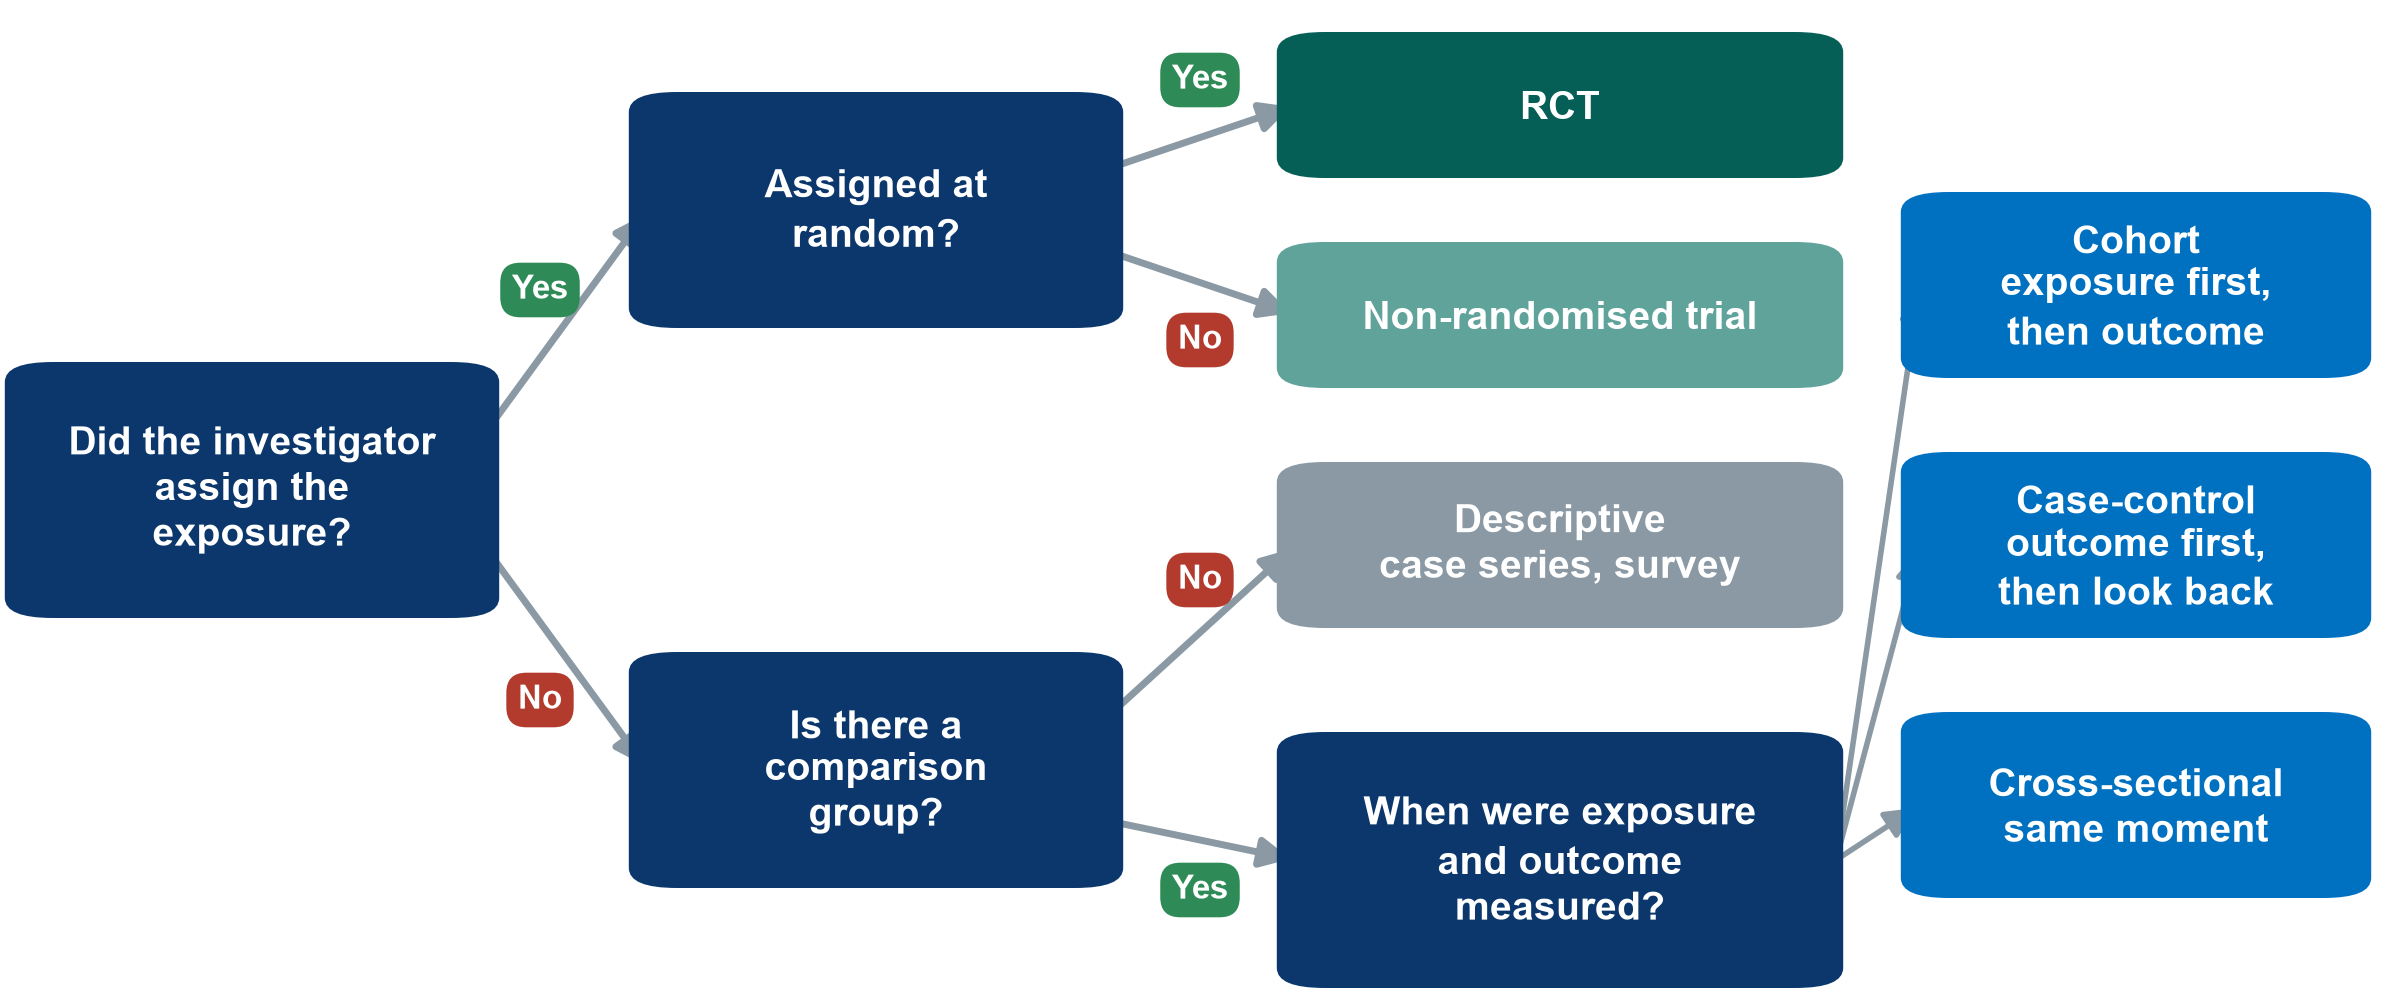
KEY MESSAGE Assigned? Random? Which way does time run? Three questions name the design.

Every design trades something away

Strengths and weaknesses at a glance

Cross-sectional

  • + quick and cheap
  • + gives prevalence
  • - which came first?

Case-control

  • + rare outcomes
  • + few patients, fast
  • - recall bias
  • - odds ratio only

Cohort

  • + clear time order
  • + risks, many outcomes
  • - slow if prospective
  • - confounding

RCT

  • + balances the unknown
  • + strongest for cause
  • - costly, ethical limits
  • - selected patients

KEY MESSAGE No design is perfect: choose the one whose weakness hurts your question least.

What can each design claim?

RCT: Paper 1, Boulet 2024 (48 patients)

  • It can claim
  • Groups alike at the start (chance)
  • A difference can be blamed on the strategy
  • Its limits
  • Too small for mortality (6 vs 6 deaths)
  • Clinicians knew the group (single-blind)

Cohort: Paper 2, Hyun 2023 (thousands)

  • It can claim
  • Large, real patients, 28-day mortality
  • ‘Associated with’ (HR 2.13 on day 2)
  • Its limits
  • Cannot prove that fluid causes death
  • Sicker patients got more fluid (confounding)

KEY MESSAGE RCTs can say ‘caused’. Cohorts should say ‘associated’.

Check your understanding: caused or associated?

QUICK QUIZ · 3 min

  • A. Paper 1, Boulet (RCT): ‘The restrictive strategy did not reduce the day-5 fluid balance’
  • B. Paper 2, Hyun (cohort): ‘A positive fluid balance causes higher 28-day mortality’
  • C. A one-day survey of ICU patients: ‘A positive fluid balance today is associated with kidney injury today’

For each sentence

  • Is the wording right for the design?
  • Vote in the poll: right or wrong

OUTPUT One poll vote (right or wrong) for each sentence

Exercise: Name that design

WHOLE-CLASS TASK · 15 min

  • Six short abstracts on our fluid question: Session 3 exercise sheet (PDF sent before the session), Part A
  • The instructor shows one abstract at a time on the shared screen
  • Vote for the design in the poll
  • A volunteer says the phrase that proves it, microphone on
  • Use the three questions: assigned? random? which way does time run?

Use the tree

  • Assigned and random: RCT
  • Outcome first, look back: case-control
  • Exposure first, follow forward: cohort
  • Same moment: cross-sectional

OUTPUT Six designs named by the class, each with one evidence phrase

Break

15 min

3.2 More designs

Real projects bend the basic designs.

Trial variants, non-inferiority, pilots, quality-improvement designs and qualitative research. (30 minutes)

Not every trial is parallel: four layouts
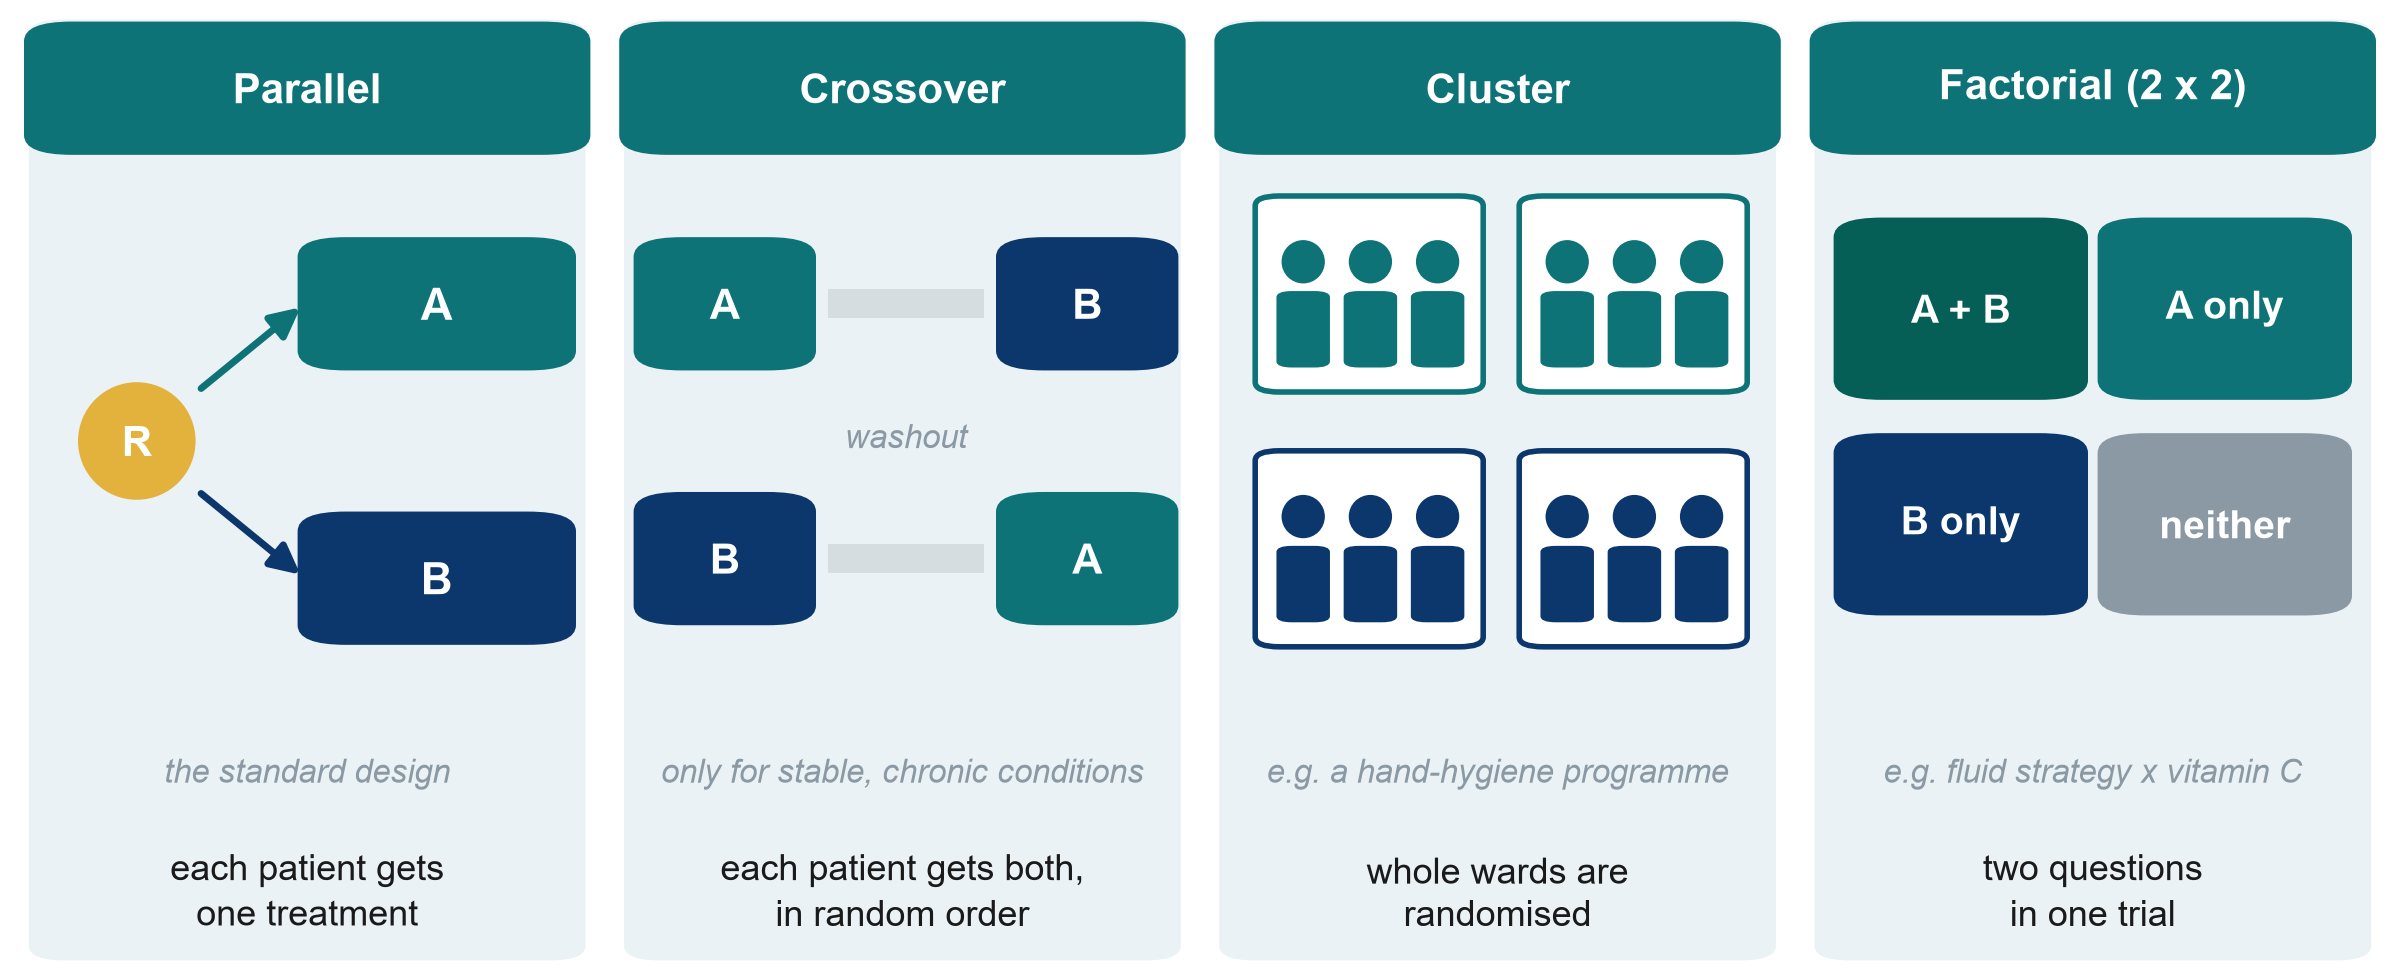
R: randomisation. A and B: the two treatments

KEY MESSAGE Choose the trial layout that fits the treatment and the unit of care.

Superiority or non-inferiority? The margin picture
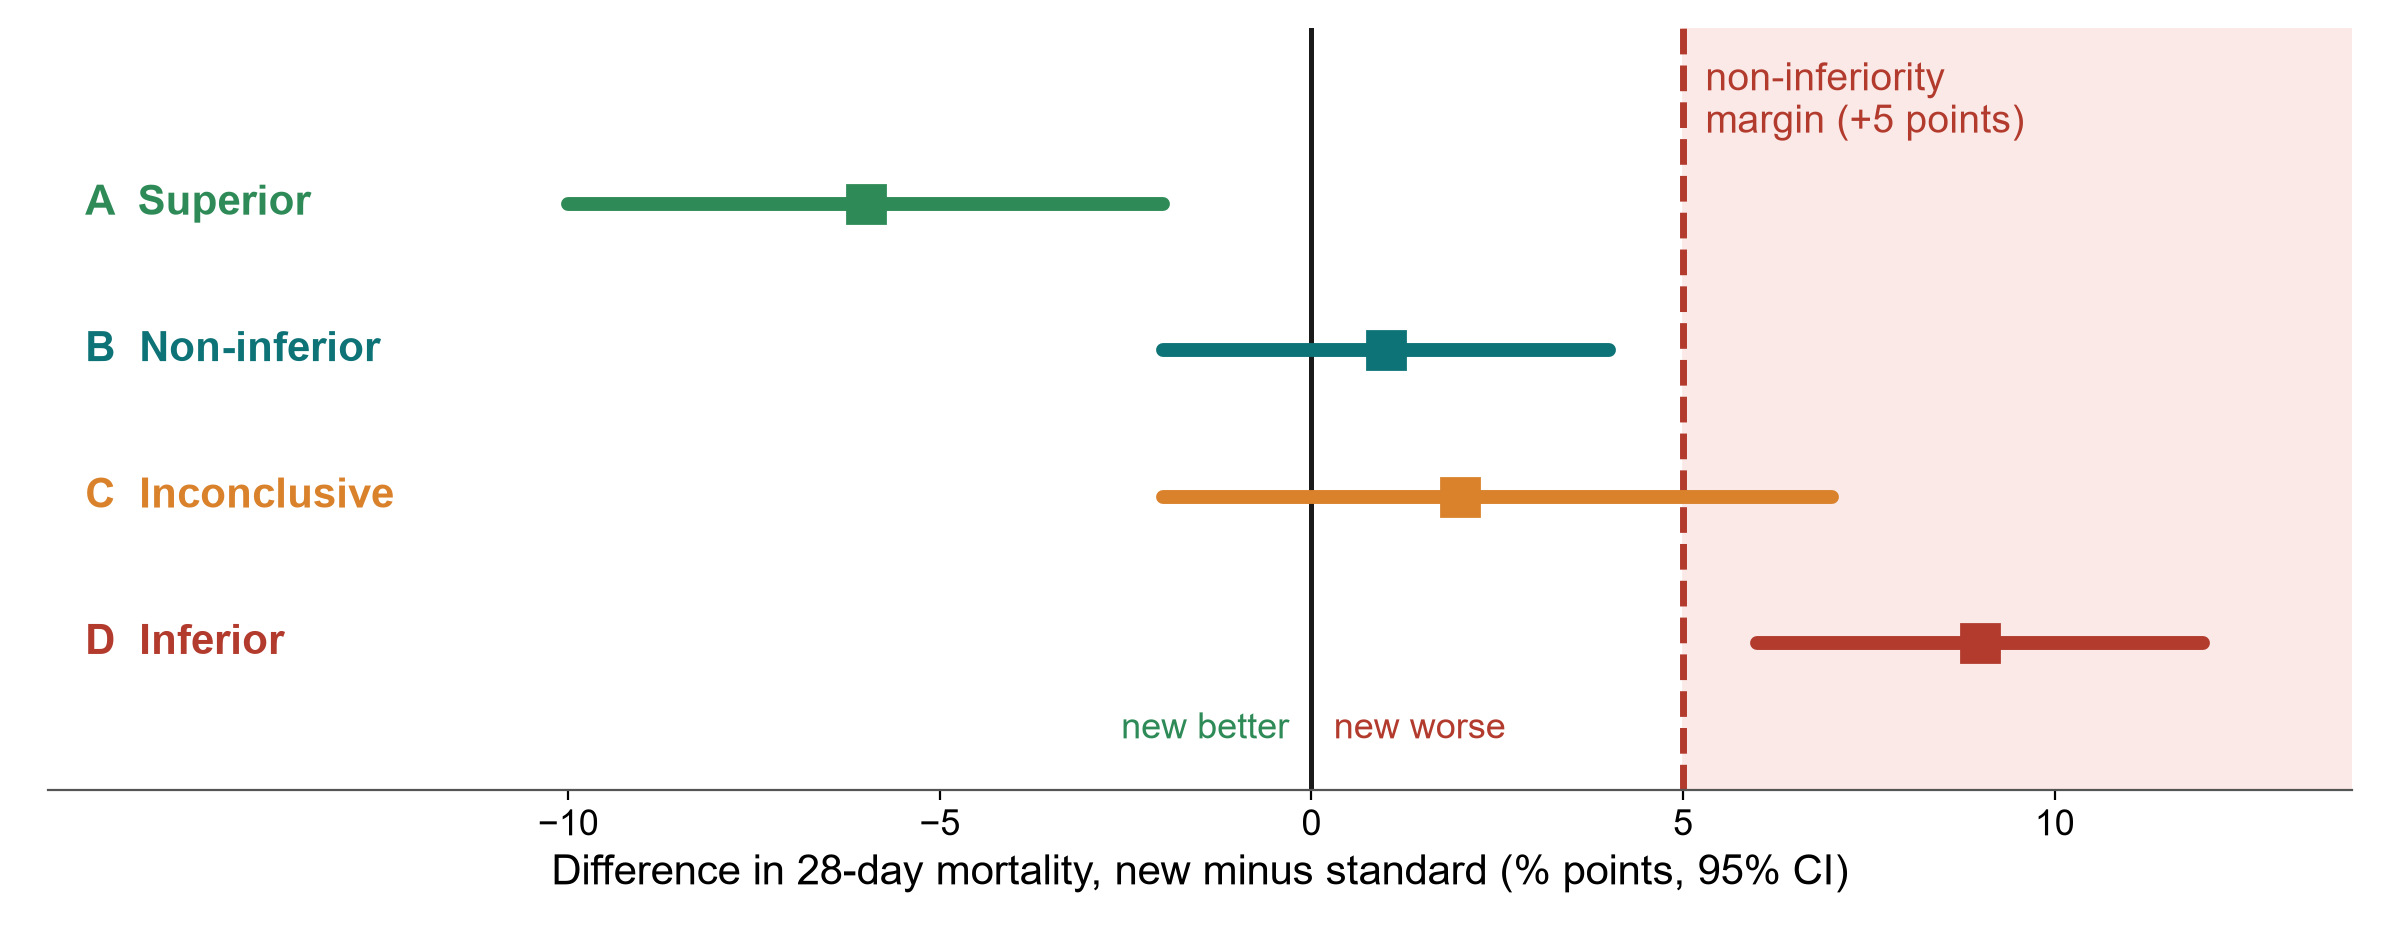
CI: confidence interval. Hypothetical results.

KEY MESSAGE Non-inferiority: the whole CI must stay below a margin fixed in advance.

Pilot and feasibility studies: the rehearsal

Paper 1, Boulet 2024: a pilot trial

  • 1,201 patients screened
  • 50 randomised (4%)
  • 48 analysed (96%)
  • About 3 patients per month across 3 ICUs

A pilot asks: can we do the big trial?

  • Can we recruit enough patients?
  • Will patients or families consent?
  • Can staff deliver the intervention?
  • Are outcomes measurable and complete?
  • What numbers do we need for the big trial?

KEY MESSAGE A pilot asks ‘can we do it?’, not ‘does it work?’

Quasi-experimental designs: before-after and interrupted time series
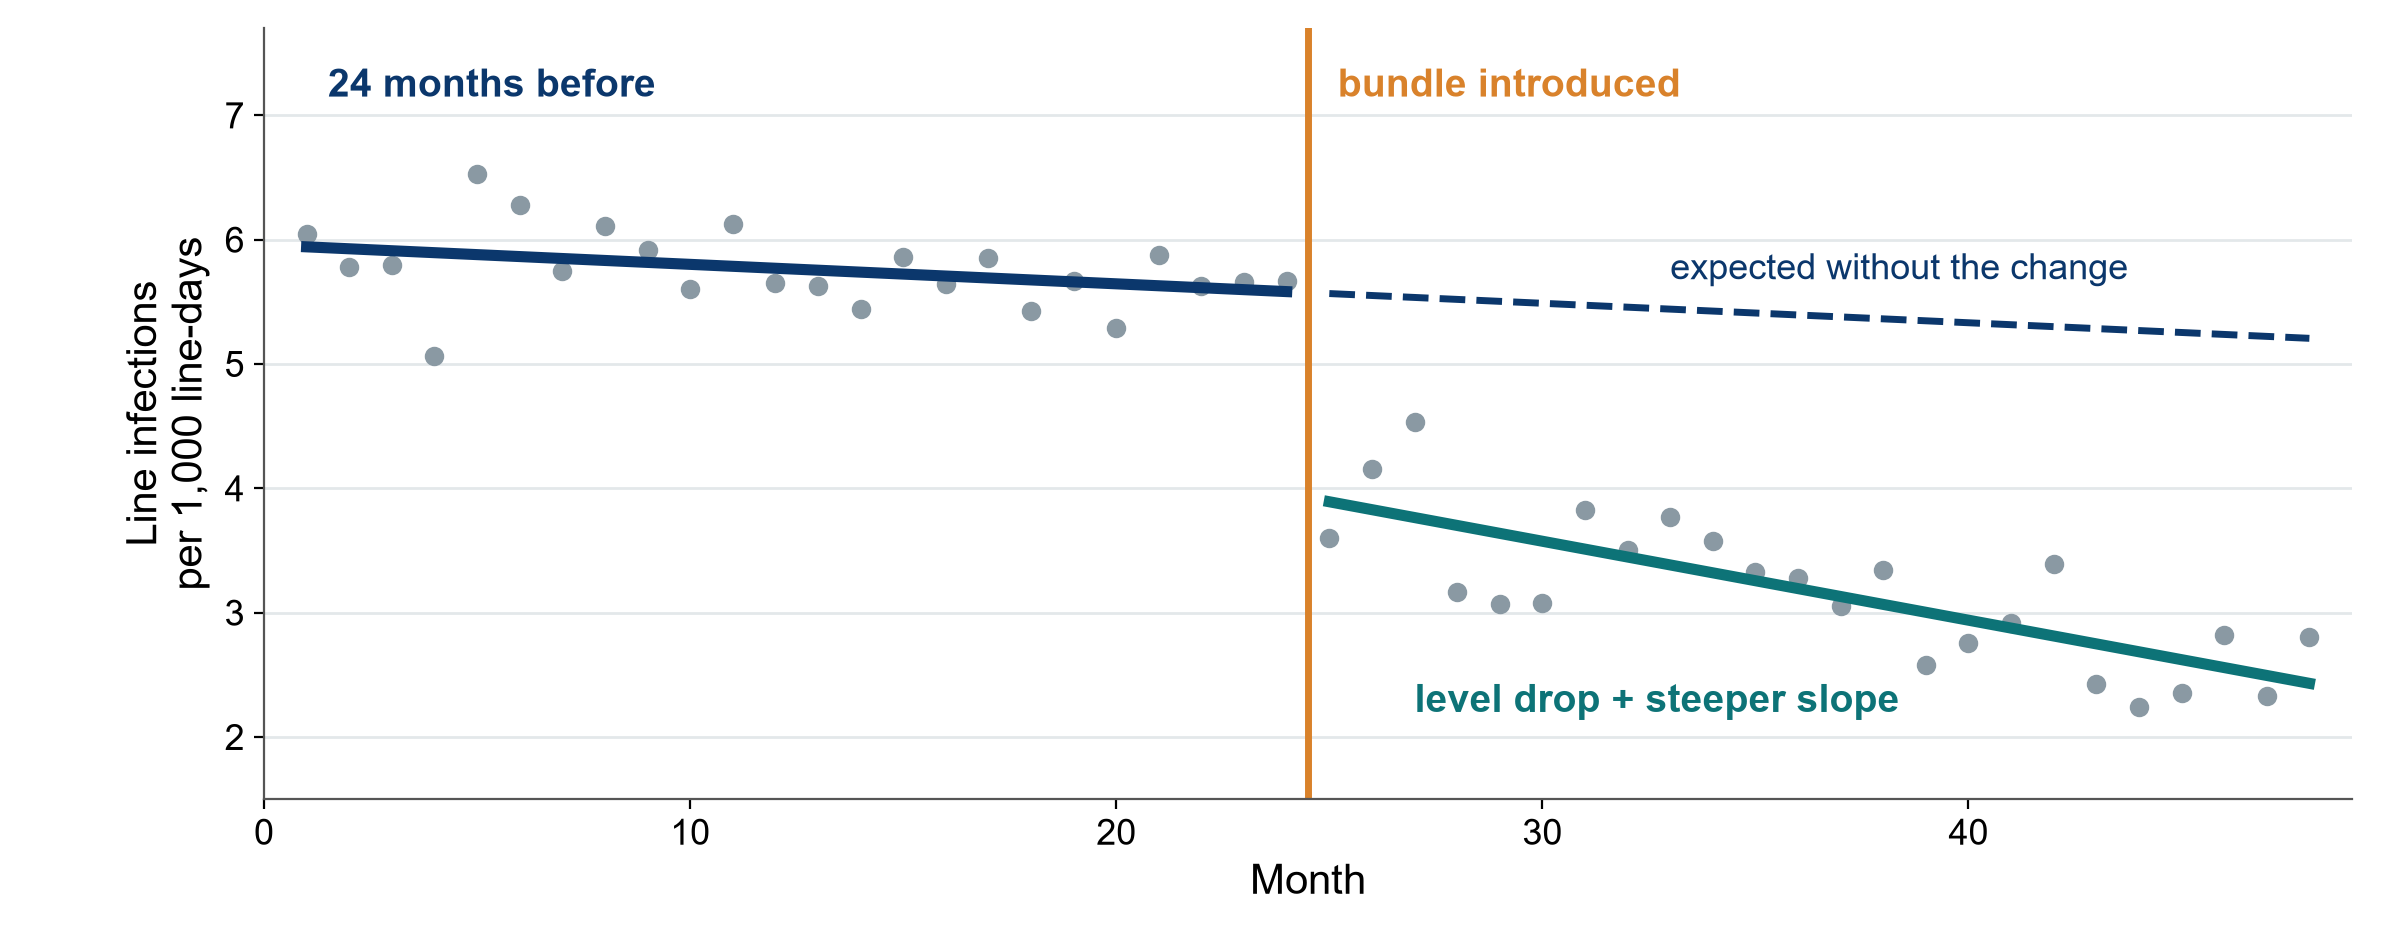
Simulated data for teaching. ITS: interrupted time series, QI: quality improvement.

KEY MESSAGE Compare against the trend you expected, not against one ‘before’ average.

Qualitative designs: when numbers cannot answer

Why? How? What is it like? Words, not numbers, analysed as themes

In-depth interviews

  • One person, open questions
  • Usually 30-60 minutes
  • e.g. why urine output goes unrecorded at night

Focus groups

  • 6-8 people discuss together
  • Views spark other views
  • e.g. how families experience consent in the ICU

Observation

  • Watch what people actually do
  • It may differ from what they say
  • e.g. how fluid charts are filled in

KEY MESSAGE Qualitative research explains why and how. It complements numbers.

Match the design to the question

If your question is… Start with Example on our fluid question
How common is it right now? Cross-sectional Patients with a positive fluid balance in our ICU today
Rare outcome: what raised the risk? Case-control Patients with sepsis who needed new dialysis, looking back at their fluid
What happens after an exposure? Cohort Positive fluid balance and death by day 28 (Paper 2)
Does this treatment work? RCT Restrictive vs usual fluids (Paper 1)
What do all the studies say? Systematic review and meta-analysis All fluid-restriction trials, pooled

Start from the question, and the design follows from it. Then check that it is feasible in your setting.

Exercise: choose the design

WHOLE-CLASS TASK · 15 min

  • Five planning questions about our fluid question: exercise sheet, Part B
  • For each: vote in the poll for the best feasible design
  • A volunteer gives one reason and the main weakness. The instructor types them on the shared screen
  • Then your own question: two or three people say their design, and ‘caused’ or ‘associated’

Remember

  • Does it work? RCT or cluster trial
  • Not worse? Non-inferiority trial
  • Already changed? Time series
  • Why or how? Qualitative
  • Can we do it? Pilot

OUTPUT Five designs chosen together, then a few people share their own design and claim

Who is in your study? Inclusion and exclusion criteria
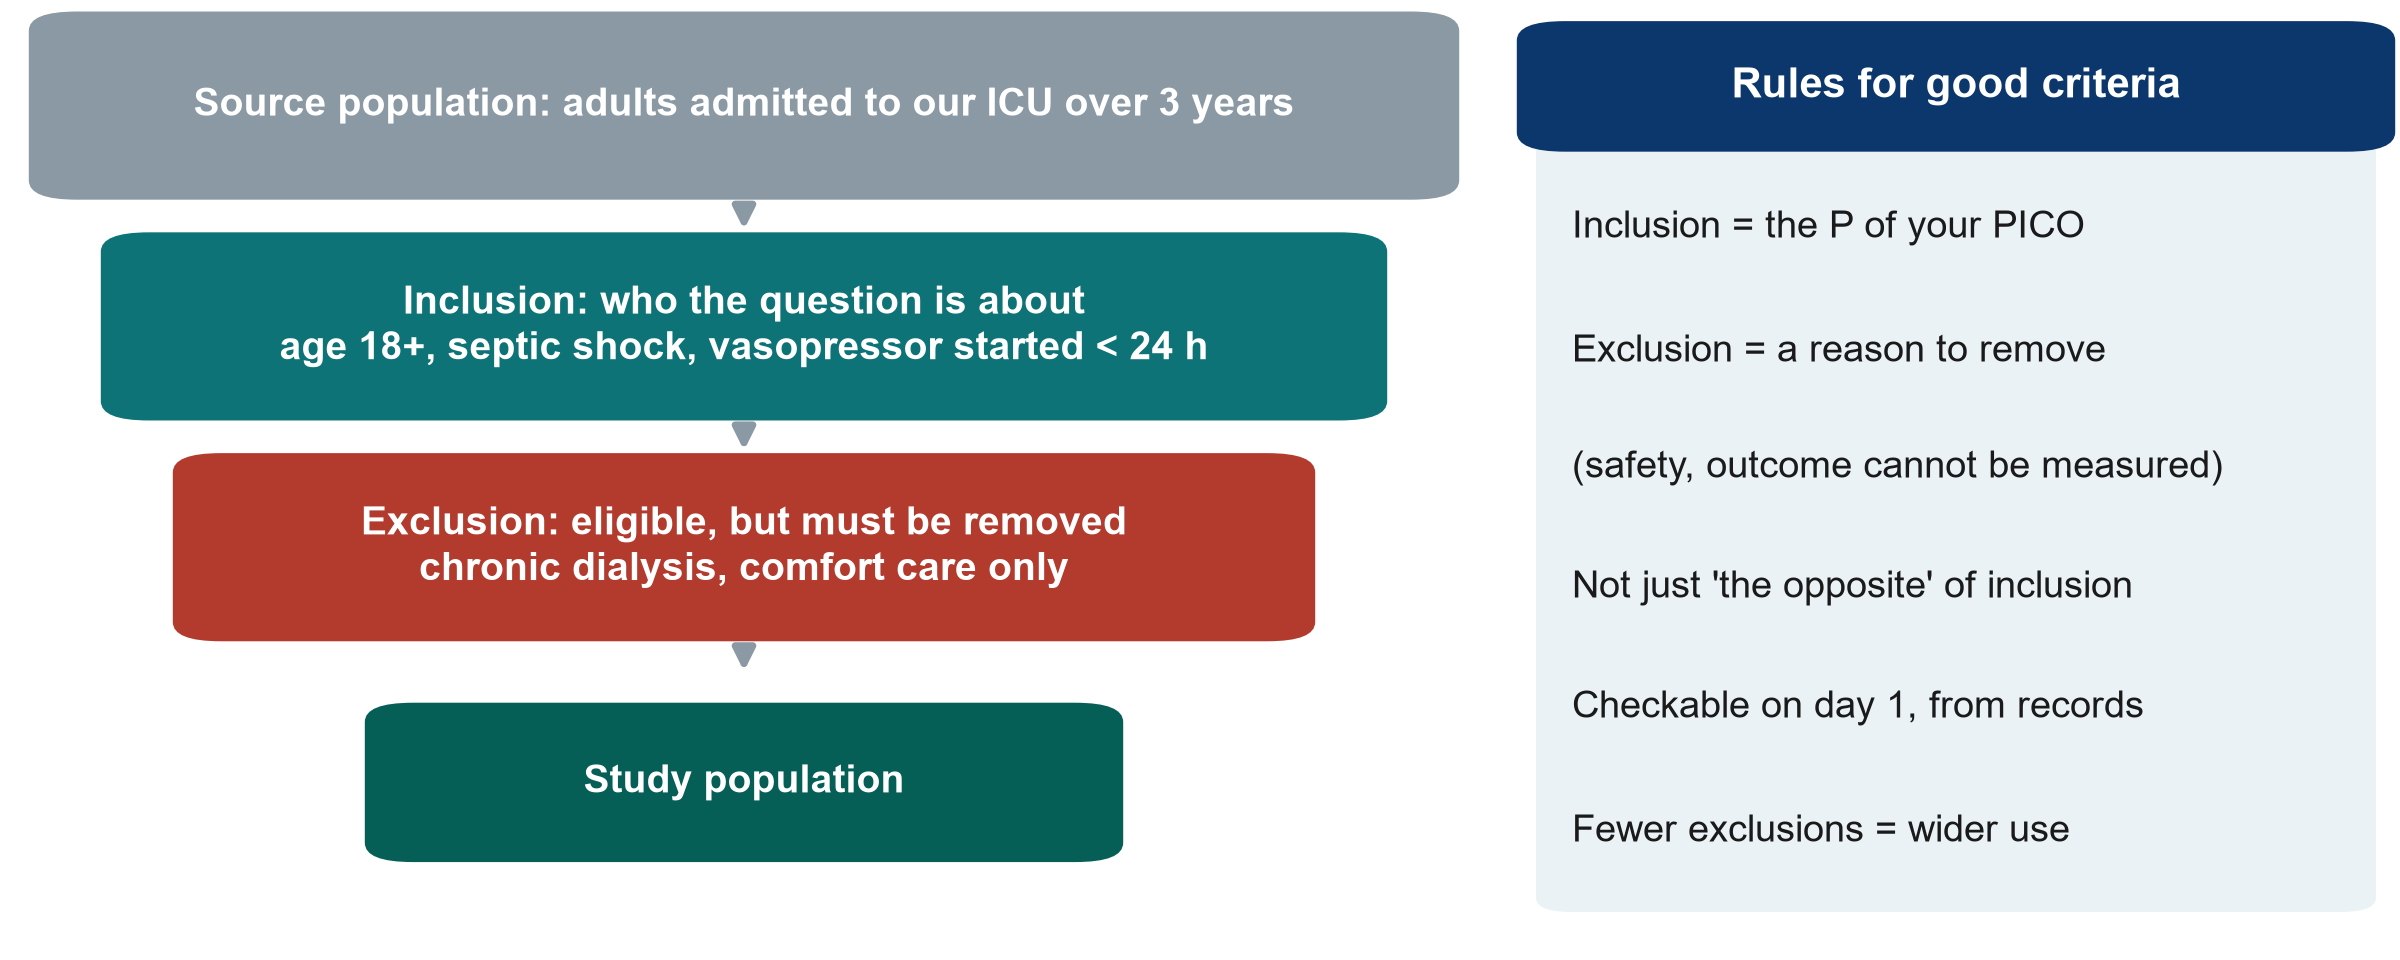
KEY MESSAGE Inclusion describes your P (Population). Exclusion removes eligible people for a stated reason.

Proposal builder 3: design, setting and population

PROPOSAL BUILDER · 45 min

  • Watch: the instructor writes Part 2a live for the running example (15 min)
  • Design and a 3-5 sentence justification, chosen with the decision tree
  • Setting: where, when, which units, which data source
  • Population: 3-5 inclusion and 3-5 exclusion criteria, each exclusion with a reason
  • Your turn: draft the same for your own question (20 min, quiet individual work)
  • Three volunteers read their design sentence aloud for feedback (7 min)

Check your draft

  • Design matches the question?
  • Feasible in your unit?
  • Inclusion = your P (Population)?
  • Each exclusion has a reason?
  • ‘Caused’ or ‘associated’?

OUTPUT Your own Proposal Part 2a drafted (finish it as homework)

Session 3 in one slide

3.1 Basic designs

  • Snapshot, look back, follow forward
  • RCT: chance assigns the exposure
  • RCT may say ‘caused’, cohort says ‘associated’

3.2 More designs

  • Cluster, crossover, factorial
  • Non-inferiority needs a margin
  • Pilot, time series, qualitative

Your proposal

  • Design and justification
  • Setting
  • Inclusion and exclusion criteria

KEY MESSAGE The question picks the design. The design decides what you may claim.

Wrap-up and homework

DISCUSSION · 5 min

  • Exit question (chat or 1-question form): doctors chose restrictive fluids for some patients with septic shock and not for others. Both groups are followed to day 28. Which design? ‘Caused’ or ‘associated’?
  • Why: it checks today’s key idea. The instructor reads every answer and opens Session 4 with them
  • Homework: finish your own Proposal Part 2a (design, setting, population)
  • Reading: ‘Patients’ in Paper 1 (Boulet) and ‘Data source’ in Paper 2 (Hyun), in Course/Papers
  • Next Saturday (Session 4): can we trust the result, and how big is the effect?

OUTPUT One exit answer per person, in the chat or the form

Extra slides: Session 3

Extra slides: Session 3

Use if time allows, or for self-study

The decision tree in action: Paper 1 (Boulet) and Paper 2 (Hyun)

Assigned?

  • Boulet: yes, the trial assigned the strategy
  • Hyun: no, clinicians decided

Random?

  • Boulet: yes, by a central computer

Comparison?

  • Hyun: yes, positive vs negative balance

Time order?

  • Hyun: exposure on days 1-3, then death by day 28

Design

  • Boulet: RCT
  • Hyun: cohort

KEY MESSAGE Walk every paper through the same questions before reading its results.

More practice (other examples): name the design

QUICK QUIZ · 3 min

  • A. All 300 inpatients are checked today for a urinary catheter and for urinary infection
  • B. Patients with ventilator-associated pneumonia are compared with patients without it for earlier sedation use
  • C. Patients who received early mobilisation (the physiotherapist’s decision) and those who did not are followed to discharge

Choose

  • Cross-sectional
  • Case-control
  • Cohort
  • RCT

OUTPUT One design named for each scenario (answers on the next slide)

Answers: name the design (other examples)

A. Cross-sectional

  • One day, everyone
  • Exposure and outcome measured together
  • Gives prevalence

B. Case-control

  • Chosen by outcome (pneumonia)
  • Look back for exposure (sedation)
  • Gives an odds ratio

C. Cohort

  • Grouped by exposure (mobilisation)
  • Followed forward to discharge
  • Not an RCT: nobody randomised

KEY MESSAGE Ask: chosen by exposure or by outcome? Assigned by chance or not?

More practice (other examples): which design?

QUICK QUIZ · 3 min

  • A. A cheaper antibiotic schedule. We only need to show it is not worse
  • B. A hand-hygiene programme delivered to whole wards
  • C. Why do families refuse research consent in the ICU?

Choose

  • Cluster trial
  • Non-inferiority trial
  • Qualitative interviews

OUTPUT One design for each (answers in the notes)

Choosing good controls in a case-control study

Same source

  • Same hospital, units and period as the cases
  • Would have become a case if they had the outcome

Same measurement

  • Same records, same questions
  • Ideally an assessor who does not know who is a case

Matching (optional)

  • e.g. age, month of admission
  • Do not match on the exposure itself

KEY MESSAGE Bad controls make any case-control study meaningless.

Superiority, equivalence and non-inferiority

CI: confidence interval. Margin: the largest difference we accept, fixed in advance

Superiority

  • Is the new treatment better?
  • Whole CI on the ‘better’ side of 0

Equivalence

  • Is it about the same?
  • Whole CI between minus and plus the margin

Non-inferiority

  • Is it not unacceptably worse?
  • Whole CI below plus the margin

KEY MESSAGE The question (better, same, not worse) is fixed in the protocol, before the data.

Making a quality-improvement evaluation stronger

More time points

  • At least 8-12 points before and after
  • Same definition every month

A control series

  • A unit or hospital without the change
  • Same months, same measure

Record co-interventions

  • Staff changes, new policies, audits
  • Write them down as they happen

KEY MESSAGE A before-after average is weak. A long, controlled time series is much stronger.